Intro
This is the first post of the malware series that me and my friend @r4sti will be starting. We basically started learning malware concepts, dev and windows internals, and I will keep track of what we learn - like the rest of the things in this blog:)
Special thanks to him cause he is basically teaching me 70% of this stuff lol.
So in this post, we will dive into:
- What is PEB
- Theory compared to a real world sample
- Code examples
- IsBeingDebugged
- Loaded DLLs
- PEB in depth - x64dbg
- How it can be abused (dll-unlinking)
What is PEB
The Process Environment Block (PEB) is a vital structure in the Windows operating system, residing in user-mode memory and accessible by the corresponding process.
Although primarily intended for use by the operating system, the PEB contains a wealth of information about the running process. This includes data on whether the process is being debugged, details on the modules loaded into memory, and the command line used to invoke the process. Due to the critical nature of this information, adversaries have several opportunities to exploit the PEB for malicious purposes.
The PEB structure based on microsoft, has the following struct:
typedef struct _PEB {
  BYTE                          Reserved1[2];
  BYTE                          BeingDebugged;
  BYTE                          Reserved2[1];
  PVOID                         Reserved3[2];
  PPEB_LDR_DATA                 Ldr;
  PRTL_USER_PROCESS_PARAMETERS  ProcessParameters;
  PVOID                         Reserved4[3];
  PVOID                         AtlThunkSListPtr;
  PVOID                         Reserved5;
  ULONG                         Reserved6;
  PVOID                         Reserved7;
  ULONG                         Reserved8;
  ULONG                         AtlThunkSListPtr32;
  PVOID                         Reserved9[45];
  BYTE                          Reserved10[96];
  PPS_POST_PROCESS_INIT_ROUTINE PostProcessInitRoutine;
  BYTE                          Reserved11[128];
  PVOID                         Reserved12[1];
  ULONG                         SessionId;
} PEB, *PPEB;
but truth is, there is a bigger, undocumented struct of PEB, which contains a lot more information about this Windows structure. Based on the NTAPI undocumented functions, the full structure of PEB is the following:
typedef struct _PEB {
  BOOLEAN                 InheritedAddressSpace;
  BOOLEAN                 ReadImageFileExecOptions;
  BOOLEAN                 BeingDebugged;
  BOOLEAN                 Spare;
  HANDLE                  Mutant;
  PVOID                   ImageBaseAddress;
  PPEB_LDR_DATA           LoaderData;
  PRTL_USER_PROCESS_PARAMETERS ProcessParameters;
  PVOID                   SubSystemData;
  PVOID                   ProcessHeap;
  PVOID                   FastPebLock;
  PPEBLOCKROUTINE         FastPebLockRoutine;
  PPEBLOCKROUTINE         FastPebUnlockRoutine;
  ULONG                   EnvironmentUpdateCount;
  PPVOID                  KernelCallbackTable;
  PVOID                   EventLogSection;
  PVOID                   EventLog;
  PPEB_FREE_BLOCK         FreeList;
  ULONG                   TlsExpansionCounter;
  PVOID                   TlsBitmap;
  ULONG                   TlsBitmapBits[0x2];
  PVOID                   ReadOnlySharedMemoryBase;
  PVOID                   ReadOnlySharedMemoryHeap;
  PPVOID                  ReadOnlyStaticServerData;
  PVOID                   AnsiCodePageData;
  PVOID                   OemCodePageData;
  PVOID                   UnicodeCaseTableData;
  ULONG                   NumberOfProcessors;
  ULONG                   NtGlobalFlag;
  BYTE                    Spare2[0x4];
  LARGE_INTEGER           CriticalSectionTimeout;
  ULONG                   HeapSegmentReserve;
  ULONG                   HeapSegmentCommit;
  ULONG                   HeapDeCommitTotalFreeThreshold;
  ULONG                   HeapDeCommitFreeBlockThreshold;
  ULONG                   NumberOfHeaps;
  ULONG                   MaximumNumberOfHeaps;
  PPVOID                  *ProcessHeaps;
  PVOID                   GdiSharedHandleTable;
  PVOID                   ProcessStarterHelper;
  PVOID                   GdiDCAttributeList;
  PVOID                   LoaderLock;
  ULONG                   OSMajorVersion;
  ULONG                   OSMinorVersion;
  ULONG                   OSBuildNumber;
  ULONG                   OSPlatformId;
  ULONG                   ImageSubSystem;
  ULONG                   ImageSubSystemMajorVersion;
  ULONG                   ImageSubSystemMinorVersion;
  ULONG                   GdiHandleBuffer[0x22];
  ULONG                   PostProcessInitRoutine;
  ULONG                   TlsExpansionBitmap;
  BYTE                    TlsExpansionBitmapBits[0x80];
  ULONG                   SessionId;
} PEB, *PPEB;
Theory compared to a real world sample
What helped us get a better grasp of PEB’s fields and how useful this struct can become from a threat actors perspective, is the analysis of LummaStealer.
I will input below the part of LummaStealer that utilizes PEB and will break it down part by part:
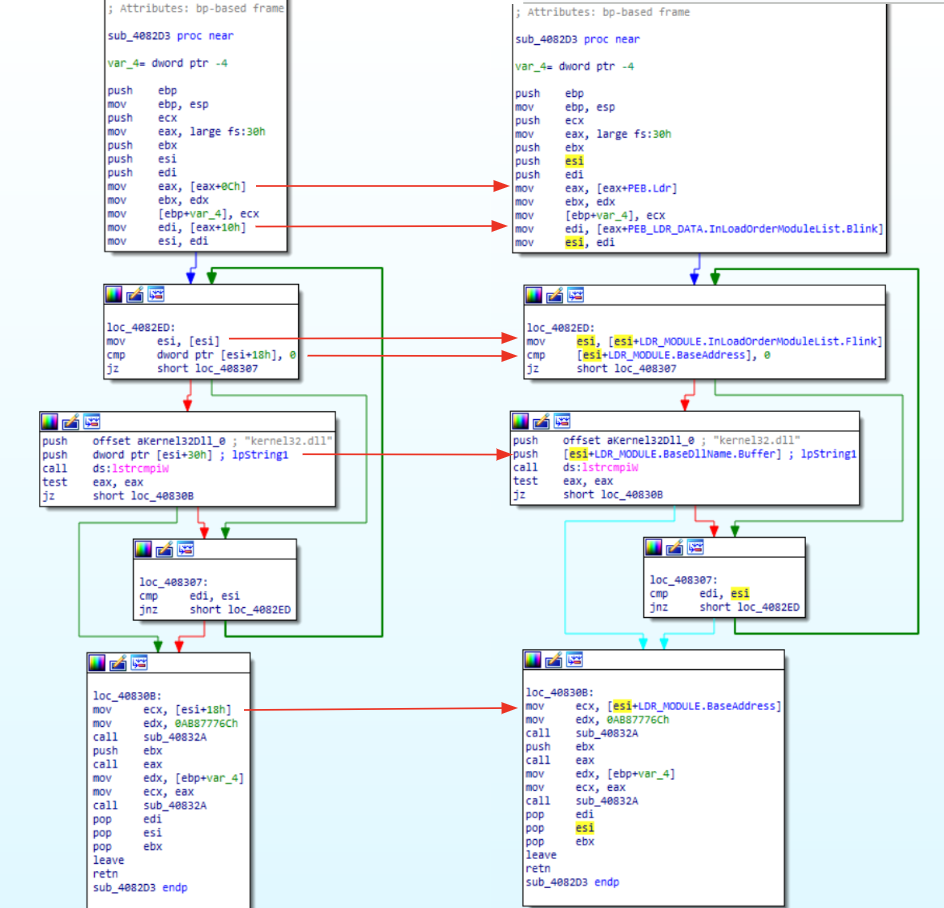
On the left we have the original assembly and on the right we have the same part of the code but renamed. We will observe why these parts have been modified as such.
We need to start from the main part of the assembly, which is the following:
Line 1. mov eax, large fs:30h		; eax = start of PEB structure
Line 2. mov eax, [eax+0x0c]		    ; eax = Ldr (pointer to PEB_LDR_DATA)
Line 3. mov esi, [eax+0x10]		    ; esi = pointer to the head of the doubly linked list InLoadOrderModuleList (this is a pointer to the first LDR_MODULE)
Line 4. mov esi, [esi]			    ; esi = stores the first LDR_MODULE
Line 5. cmp dword ptr [esi+0x18], 0	; esi+0x18 is the BaseAddress field
Line 1: In line 1 the malware loads the address of the PEB structure by utilizing the fs:30h segment. It uses the fs segment because the code was written for x32 bit architecture. If it was written for x64 bit architecture, it would use the gs:60h segment.
Line 2: In line 2 it loads the Ldr field from the PEB structure. We can see that it uses [eax+0x0c] to do so (remember that eax has the fs:30h loaded to it, or in other words the PEB struct). To understand why [eax+0x0c] ( or basically PEB[0x0c] ) is landing on the Ldr field, we must observe what exists on the 0x0c offset of the PEB structure:
typedef struct _PEB {
  BYTE			Reserved1[2];	// offset = 0x00 --> it stores 2 bytes
  BYTE  		BeingDebugged;	// offset = 0x02 --> it stores 1 byte
  BYTE  		Reserved2[1];	// offset = 0x03 --> it stores 1 byte
  PVOID 		Reserved3[2];	// offset = 0x04 --> it stores 2*4 bytes (PVOID is 4 bytes)
  PPEB_LDR_DATA 	Ldr;		// offset = 0x0c
  ...
Line 3: From the previous code section, we saw that the malware loaded Ldr by using the offset 0x0c. Then, the line mov edi, [eax + 10h] has been renamed to mov edi, [eax + PEB_LDR_DATA.InLoadOrderModuleList.Blink]. Why is that? Well, eax was previously set to Ldr (mov eax, [eax+0x0c]), and we added the offset 10h (mov esi, [eax+0x10]). So let’s simply view the PEB_LDR_DATA struct and see what exists in the 0x10 offset:
typedef struct _PEB_LDR_DATA
{
     DWORD          Length;                             // offset = 0x00
     BYTE           Initialized[4];                     // offset = 0x04
     void*          SsHandle;                           // offset = 0x08
     LIST_ENTRY     InLoadOrderModuleList;              // offset = 0x0c
       `---->           _LIST_ENTRY *Flink;             // offset = 0x0c
       `---->           _LIST_ENTRY *Blink;             // offset = 0x10
     LIST_ENTRY     InMemoryOrderModuleList;            // offset = 0x14
     LIST_ENTRY     InInitializationOrderModuleList;    // offset = 0x1C
     void*          EntryInProgress;                    // offset = 0x24
} PEB_LDR_DATA;
In the _PEB_LDR_DATA struct I have added the contents of the LIST_ENTRY struct (it has two subfields).
We can see that the offset 0x10 is landing inside the InLoadOrderModuleList and specifically in the Blink field. But what is the InLoadOrderModuleList and its Blink and Flink fields…??!!??
Well, the InLoadOrderModuleList is a double linked list where its elements (Flink and Blink) are pointers to some LDR_MODULE (or as it is called today LDR_DATA_TABLE_ENTRY)
To put it simply, when an executable runs, the DLL’s it uses are stored in the LDR_MODULE struct. This stuct has the following fields:
typedef struct _LDR_MODULE {
  LIST_ENTRY              InLoadOrderModuleList;            // offset = 0x00
     `---->           _LIST_ENTRY *Flink;                   // offset = 0x00
     `---->           _LIST_ENTRY *Blink;                   // offset = 0x04
  LIST_ENTRY              InMemoryOrderModuleList;          // offset = 0x08
  LIST_ENTRY              InInitializationOrderModuleList;  // offset = 0x10
  PVOID                   BaseAddress;                      // offset = 0x18
  PVOID                   EntryPoint;                       // offset = 0x1c
  ULONG                   SizeOfImage;                      // offset = 0x20
  UNICODE_STRING          FullDllName;                      // offset = 0x28
  UNICODE_STRING          BaseDllName;                      // offset = 0x30
  ULONG                   Flags;
  SHORT                   LoadCount;
  SHORT                   TlsIndex;
  LIST_ENTRY              HashTableEntry;
  ULONG                   TimeDateStamp;
} LDR_MODULE, *PLDR_MODULE;
All the elements of this list can be parsed with the help of InLoadOrderModuleList and specifically the Blink and Flink fields, which just point to the previous (B-ackwards) and next (F-orward) DLL List entry. A picture that perfectly depicts this is the following:
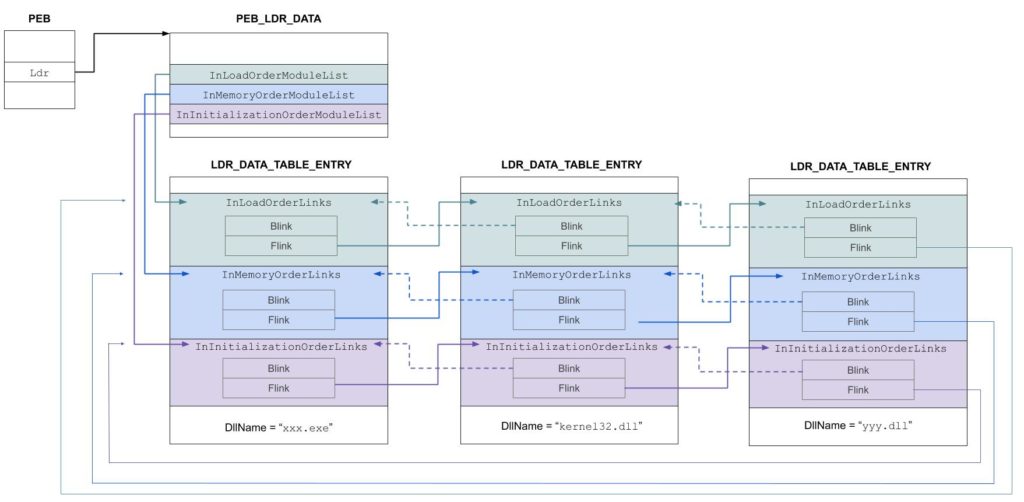
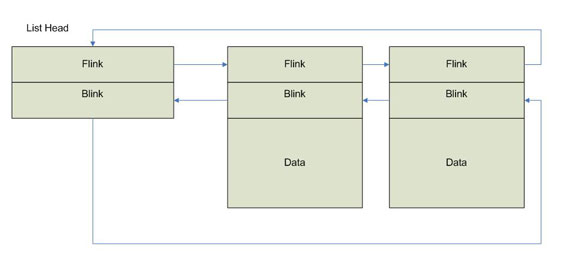
The first element of the list is the far left.
Line 4: So at this point, the malware just loaded LDR through PEB and the esi register (mov esi, [esi]) contains the Blink of the List Head that points to the last LDR_MODULE. By dereferencing esi ([esi]), esi will basically “execute” the pointing to the previous LDR_MODULE. Now, we have landed on the previous LDR_MODULE and specifically on the Flink field. Why?
By dereferencing esi, we are now refering on the offset 0x00 - the start of where the esi is pointing. But since esi is pointing to the previous LDR_MODULE on offset 0x00, by looking at the LDR_MODULE struct, we see that the offset 0x00 is the InLoadOrderModuleList and specifically the Flink field since it is the first of the InLoadOrderModuleList's subfields (so they have the same offset).
Line 5: Looking at the LDR_MODULE struct once again, at offset 0x18 we see the BaseAddress field (or DllBase). The check for the BaseAddress is made to make sure no errors have occur and the program won’t crash because of perhaps some invalid entry.
So, in order to locate the KERNEL32.DLL, the code loops through all modules of the InLoadOrderModuleList with the help of the Flink and Blink pointers. Every time in the loop, it moves to the next module of the list, storing the Flink pointer that points to the next element of the list.
For each module, it loads its BaseDllName (push dword ptr [esi+30h]) and it checks if it is the KERNEL32.DLL.
Moving forward, esi (since it is now a Double linked list) will eventually end up back in the List Head, which is stored in the edi register. That is why in the code the cmp edi, esi is the loop termination condition.
Finally, after the loop, it takes the base address of the DLL and a hash, where it proceeds to do API hashing.
Code examples
Now that we have reviewed the part of the malware that utilized PEB and we have become familiar with it, let’s start writting some code examples in C and play around with PEB.
Code example 1 - IsBeingDebugged
In this chapter we will write a simple script that uses PEB’s isBeingDebugged field to try and see if our running executable is loaded into a debugger or not.
#include <stdio.h>
#include <Windows.h>
#include <winternl.h>

int main(int argc, wchar_t* argv[])
{
    PPEB pPEB = (PPEB)__readgsqword(0x60);

    // First way: Point to field with ->
    BYTE being_debugged = pPEB->BeingDebugged;
    printf("IsBeingDebugged: %d\n", being_debugged);

    // Second way: Point to field with offset
    DWORD flag = *(PBYTE)((PBYTE)pPEB + 0x02); // we could also use BYTE instead of DWORD
    printf("IsBeingDebugged: %d\n", flag);

    return 0;
}
Here we see two way different ways of getting the IsBeingDebugged field. Let’s break them down!
Reading the PEB
Starting off, we read the PEB struct by using the __readgsqword(0x60) since the system is a x64 one. We then cast the result to (PPEB) type which is basically a pointer that points to the PEB struct.
First method
The first method that I personally find the easiest is by using the ‘->’ symbol. This way we basically use a struct and point (->) to the field within it:
PPEB pPEB = (PPEB)__readgsqword(0x60);            // read PEB
BYTE being_debugged = pPEB->BeingDebugged;        // point to the field within the PEB struct
printf("IsBeingDebugged: %d\n", being_debugged);  // print whether the exe is being debugged
Second method
The second method is a bit trickier since we have to calculate the offset from the struct based on the data types and the size they fill in memory. After we calculate the correct offset, we just do the correct byte casting and print the result:
PPEB pPEB = (PPEB)__readgsqword(0x60);                       // read PEB
DWORD flag = *(PBYTE)((PBYTE)pPEB + 0x02);                   // point to the field within the PEB struct
printf("IsBeingDebugged with offset pointer: %d\n", flag);   // print whether the exe is being debugged
In more details, the pPEB is a pointer to the PEB struct. By casting to (PBYTE)pPEB, we can now treat the address of the PEB struct as a sequence of bytes rather than a specific struct.
So, by doing (PBYTE)pPEB + 0x02 we are now pointing to the byte sequence at offset 0x02.
Finally, we use the outer *(PBYTE) to dereference the previous byte address and access the actual bytes inside the address.
Running the code
After running the code in visual studio, we see that the returned value is 0 (False), which means that our executable was not being debugged:
However, if we run it again using the Local Windows Debugger in VS code, both our methods return 1 (True), which means our executable successfully recognized it was being debugged: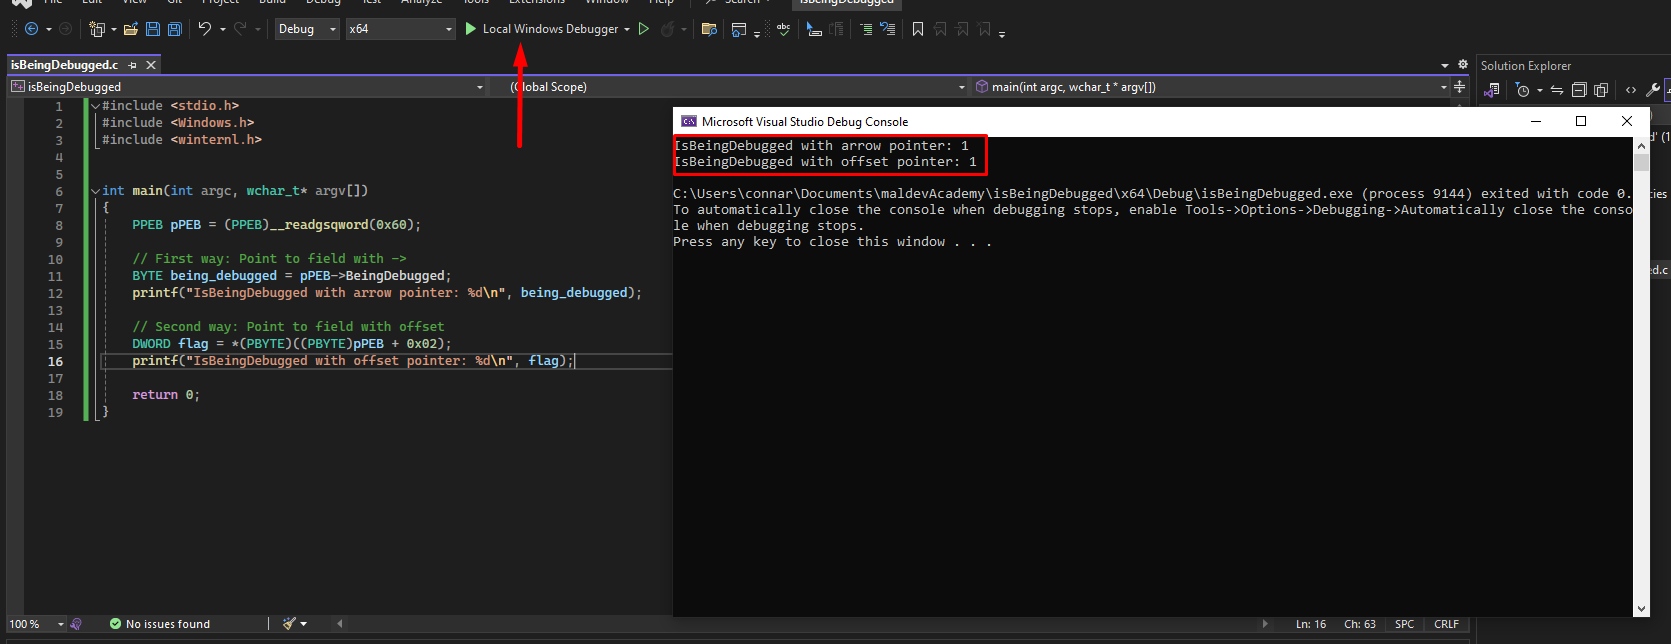
We will later see this in x64dbg were we will dive deeper into other PEB struct fields.
Code example 2 - Loaded DLLs
Although in the previous example we had direct access to the IsBeingDebugged field of the PEB structure, this will not always be the case. Often times, we will not have direct access to all fields of a struct and thus we will have to define it ourselfs in order to get the desired data.
In this code example, we will see how to land on the LDR struct that exists inside the PEB struct and get the list of loaded modules that our executable is using. The code that does this is the following:
#include <stdio.h>
#include "Windows.h"
#include "winternl.h"

typedef struct _PEB_LDR_DATA_full
{
    ULONG Length;
    BOOLEAN Initialized;
    HANDLE SsHandle;
    LIST_ENTRY InLoadOrderModuleList;
    LIST_ENTRY InMemoryOrderModuleList;
    LIST_ENTRY InInitializationOrderModuleList;
    PVOID EntryInProgress;
    BOOLEAN ShutdownInProgress;
    HANDLE ShutdownThreadId;
} PEB_LDR_DATA_full, * PPEB_LDR_DATA_full;

typedef struct _LDR_MODULE_full {
    LIST_ENTRY              InLoadOrderModuleList;
    LIST_ENTRY              InMemoryOrderModuleList;
    LIST_ENTRY              InInitializationOrderModuleList;
    PVOID                   BaseAddress;
    PVOID                   EntryPoint;
    ULONG                   SizeOfImage;
    UNICODE_STRING          FullDllName;
    UNICODE_STRING          BaseDllName;
    ULONG                   Flags;
    SHORT                   LoadCount;
    SHORT                   TlsIndex;
    LIST_ENTRY              HashTableEntry;
    ULONG                   TimeDateStamp;

} LDR_MODULE_full, * PLDR_MODULE_full;

int main(int argc, wchar_t* argv[])
{

    #ifdef _WIN64
        PPEB pPEB = (PPEB)__readgsqword(0x60);
    #else
        PPEB pPEB = (PPEB)__readfsdword(0x30);
    #endif

    PPEB_LDR_DATA_full pLdr = pPEB->Ldr;

    // Access the InLoadOrderModuleList
    LIST_ENTRY* pListEntry = pLdr->InLoadOrderModuleList.Flink;
    LIST_ENTRY* pListHead = &pLdr->InLoadOrderModuleList;

    // Traverse the InLoadOrderModuleList and print the BaseAddress and BaseDllName of each module
    while (pListEntry != pListHead) {
        PLDR_MODULE_full pLdrModule = CONTAINING_RECORD(pListEntry, LDR_MODULE_full, InLoadOrderModuleList);

        // Print the BaseAddress and BaseDllName
        printf("BaseAddress: %p\n", pLdrModule->BaseAddress);
        wprintf(L"BaseDllName: %wZ\n", &pLdrModule->BaseDllName);

        // Move to the next entry
        pListEntry = pListEntry->Flink;
    }

    return 0;
}
Reading the PEB and its Ldr field
Let’s break down the code. Starting off, we have the following lines of code:
#ifdef _WIN64
    PPEB pPEB = (PPEB)__readgsqword(0x60);
#else
    PPEB pPEB = (PPEB)__readfsdword(0x30);
#endif

PPEB_LDR_DATA_full pLdr = pPEB->Ldr;
Basically, our code checks whether the system is a 64 bit system or a 32 bit system in order to know how to read the PEB struct. You can tell from the way it reads it:
- __readgsqword(0x60) –> gsqword and 0x60 offset –> 64 bit system
- __readfsdword(0x30) –> fsdword and 0x30 offset –> 32 bit system
After the code has recognized the system, it reads the Ldr field of the PEB struct. But wait a minute. Why do we cast the pLdr to a PPEB_LDR_DATA_full? Why didn’t we do the same in the IsBeingDebugged example?
Turns out, some Windows structs are not fully documented and thus there are limitations by frameworks such as VS code as to what fields it identifies. So if we were to use the Microsoft’s PEB_LDR_DATA struct we would be able to read very limited fields. The PEB_LDR_DATA that Microsoft docs provide is the following:
typedef struct _PEB_LDR_DATA {
  BYTE       Reserved1[8];
  PVOID      Reserved2[3];
  LIST_ENTRY InMemoryOrderModuleList;
} PEB_LDR_DATA, *PPEB_LDR_DATA;
While the full (undocumented) LDR struct is the following:
typedef struct _PEB_LDR_DATA_full
{
    ULONG Length;
    BOOLEAN Initialized;
    HANDLE SsHandle;
    LIST_ENTRY InLoadOrderModuleList;
    LIST_ENTRY InMemoryOrderModuleList;
    LIST_ENTRY InInitializationOrderModuleList;
    PVOID EntryInProgress;
    BOOLEAN ShutdownInProgress;
    HANDLE ShutdownThreadId;
} PEB_LDR_DATA_full, * PPEB_LDR_DATA_full;
And thus this is the one we are using since we later on in the code try to read the InLoadOrderModuleList. Now this explains the one of the two self defined structs we have written in our code.
To summarise before continuing, the code:
- reads the PEB field depending on the system’s architecture.
- defines the full LDR struct and proceeds to read and store it in the pLdr variable, which is a pointer pointing at that struct (and all its fields).
Reading Ldr->InLoadOrderModuleList’s fields
Continuing on, we have these two lines of code:
// Access the InLoadOrderModuleList
LIST_ENTRY* pListEntry = pLdr->InLoadOrderModuleList.Flink;
LIST_ENTRY* pListHead = &pLdr->InLoadOrderModuleList;
After our previous read of the LDR struct, we now try and read its InLoadOrderModuleList’s subfields, the Flink and Blink. Why? Well, as we descriped earlier on, the InLoadOrderModuleList contains a list of modules that our executable loads on runtime. This is a double linked list and we can move to the next or previous module (DLL) by using the Flink (Forward) and Blink (Backward) subfields. So this is the reason we read these fields in these lines. More specifically, we:
- Use the arrow pointing method, which is more easy to use.
- For the Blink field, we use the ‘&’ address symbol for the reason described in the LummaStealer analysis section. As a small reminder, the pListEntry points to the first module in the InLoadOrderModuleList while the pListHead (that uses the ‘&’ address symbol) points to the head of the list which does not contain any DLL’s. It is simply the start of the list as shown in previous pictures. If we were to dereference this address (with a ‘*’) then the pListHead would actually use the Flink (which at this point just has its address) and would point to the first DLL loaded in the list - which is exactly what the pListEntry points at. So we just keep its address for the loop comparison instead of the actual DLL it points at.
Another reason we need to read the ListEntry and the ListHead is for the following loop, in order to know when we will eventually do a circle and land again on the ListHead.
Looping through all loaded DLL’s
After we have successfully located the ListEntry and ListHead, we will start to loop through the list and print each DLL and its address:
    // Traverse the InLoadOrderModuleList and print the BaseAddress and BaseDllName of each module
    while (pListEntry != pListHead) {
        PLDR_MODULE_full pLdrModule = CONTAINING_RECORD(pListEntry, LDR_MODULE_full, InLoadOrderModuleList);

        // Print the BaseAddress and BaseDllName
        printf("BaseAddress: %p\n", pLdrModule->BaseAddress);
        wprintf(L"BaseDllName: %wZ\n", &pLdrModule->BaseDllName);

        // Move to the next entry
        pListEntry = pListEntry->Flink;
    }
We can see at the end of the loop that the ListEntry changes to the next loaded DLL by doing pListEntry->Flink - basically using Flink to go to the next DLL. The loop runs until the pListEntry matches the pListHead we stored previously. This means we have completed the looping of the list and there are no more DLL’s loaded in it.
Lastly, the way we load each DLL is by using the CONTAINING_RECORD macro definition. The full definition of this macro is the following:
#define CONTAINING_RECORD(address, type, field) ((type *)((PCHAR)(address) - (ULONG_PTR)(&((type *)0)->field)))
- address: This is the address of the field within the structure. So by using the
pListEntry, we pass the pointed to the address of the loaded DLL at that time. - type: This is the type of the parent structure. Here we passed the
LDR_MODULE_fullsince this is the parent structure that contains theInLoadOrderModuleListsubfield that we use to load the DLL’s. - field: This is the subfield we want to use from the parent structure. Here we used the
InLoadOrderModuleListsince this is the one we utilized to load the DLL’s.
Basically, pListEntry points to a LIST_ENTRY structure (Flink of the current entry). The macro calculates the address of the LDR_MODULE_full structure by subtracting the offset of the InLoadOrderModuleList field from pListEntry. This gives us a pointer to the LDR_MODULE_full structure containing the LIST_ENTRY. So pListEntry is nothing more than a list element pointing to a DLL - it is not the actual DLL. That’s why we use CONTAINING_MACRO, to get the actual full DLL struct and then cast to PLDR_MODULE_full, since that’s what is returned to us.
Printing the addresses and DLL’s
Last but not least, the following two lines handle the printing of the DLL’s address and name:
printf("BaseAddress: %p\n", pLdrModule->BaseAddress);
wprintf(L"BaseDllName: %wZ\n", &pLdrModule->BaseDllName);
The first print statement just uses %p to print the base address to which the pointer is pointing at.
The second print statement is a bit more complex. Let’s break it down:
- wprintf: This print statement is used for wide-character strings (wchar_t). So the preceding w stands for wide.
- L"BaseDllName: %wZ\n": The L prefix tells the compiler that the string that is about to be print should be treated as a wide-character string (wchar_t). The %wZ when used with wprintf tells the function to format the string as a wide-character string. It is basically a placeholder for wchar_t type strings (wide-character strings).
After running the full code we broke down, we will get the following results:
BaseAddress: 00007FF76D220000
BaseDllName: isBeingDebugged.exe
BaseAddress: 00007FF9AB6B0000
BaseDllName: ntdll.dll
BaseAddress: 00007FF9A97A0000
BaseDllName: KERNEL32.DLL
BaseAddress: 00007FF9A8ED0000
BaseDllName: KERNELBASE.dll
BaseAddress: 00007FF998190000
BaseDllName: VCRUNTIME140D.dll
BaseAddress: 00007FF9850A0000
BaseDllName: ucrtbased.dll
In the following section, we will see the same executable in x64dbg and see in action how all these fields show up in a debugger and how to identify them:)
PEB in depth - x64dbg
Now that we have a fully working executable that enumerates the InLoadModuleList to get the DLLs, let’s load it in x64dbg and see the relevant fields while debugging the exe.
We first need to uncheck the System Breakpoint by going to Options->References:
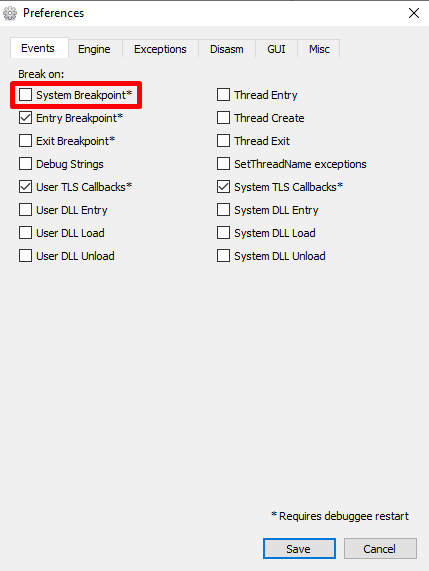
The reason is that the x64dbg would land on the ntdll if we had a system breakpoint checked. For more information regarding this, advise this video from OALABS.
After that, when we load the executable the debugging will start on the target. We then need to locate the invoke main instruction:

Going through the instructions, eventually we will find the PEB struct (gs:60h):

To go into the full struct, we need to either follow the address loaded to rax (since the PEB is moved to the rax register) or just use CTRL+G and write “peb()”. Both these are equal and will give/land us to the base address of the PEB:

PEB BaseAddress
After we have landed on the base address of the PEB struct, we need to follow this address in the memory dump. We can do this by write clicking–>Follow in Dump–>Selected Address. This will lead us to the PEB address, and in the following image we can see some of the most important fields of PEB:

As a reference, here is the relevant fields in the PEB struct:
typedef struct _PEB {
  BOOLEAN                 InheritedAddressSpace;
  BOOLEAN                 ReadImageFileExecOptions;
  BOOLEAN                 BeingDebugged;
  BOOLEAN                 Spare;
  HANDLE                  Mutant;
  PVOID                   ImageBaseAddress;
  PPEB_LDR_DATA           LoaderData;
  -- more --
}
The underlined addresses are of Pointer type. Pointers can also not be underlined if they point to a null reference.
ImageBaseAddress
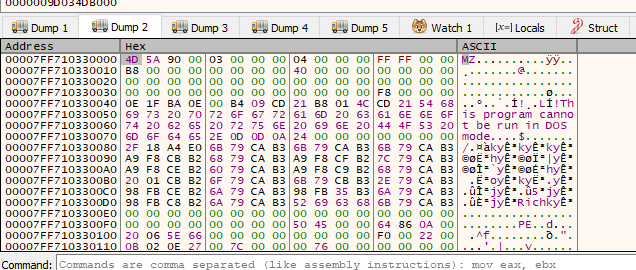
To land for example in the ImageBaseAddress field - the green address - we just need to highlight the corresponding address (0x00007FF710330000 (big endian)), right click on it and chose Follow QWORD Map->Dump 2. This will show the MZ header which means it has landed on the exe itself:
Ldr
To land on the Ldr struct, we need to follow the second pointer highlighted in blue with address 0x00007FF9AB81C4. As previously, follow the QWORD in Dump 3. You should see something like the following:

| Offset | Address | Field | Subfield | Value |
|---|---|---|---|---|
0x00 | 0x7FF9AB81C4D0 | InLoadOrderModuleList | Flink | 0x000001DEC5D82D40 |
0x08 | Blink | 0x000001DEC5D8DE30 | ||
0x10 | 0x7FF9AB81C4E0 | InMemoryOrderModuleList | Flink | 0x000001DEC5D82D50 |
0x18 | Blink | 0x000001DEC5D8DE40 | ||
0x20 | 0x7FF9AB81C4EF | InInitializationOrderModuleList | Flink | 0x000001DEC5D828D0 |
0x28 | Blink | 0x000001DEC5D8DC00 |
We will only analyze the InLoadOrderModuleList since the rest of the lists follow the same logic. Also, the List Head is contained in these lists.
Flink and Blink Pointers of the List Head
Let’s follow the Flink Pointer of InLoaderModuleList in the address 0x000001DEC5D82D40 (see the previous table):

The InLoadMemoryOrderLinks, InMemoryOrderLinks, InInitializationOrderLinks are of type LIST_ENTRY and they contain just two pointers, a Flink that points to the next element of the list, and a Blink pointing to the previous element of the list.
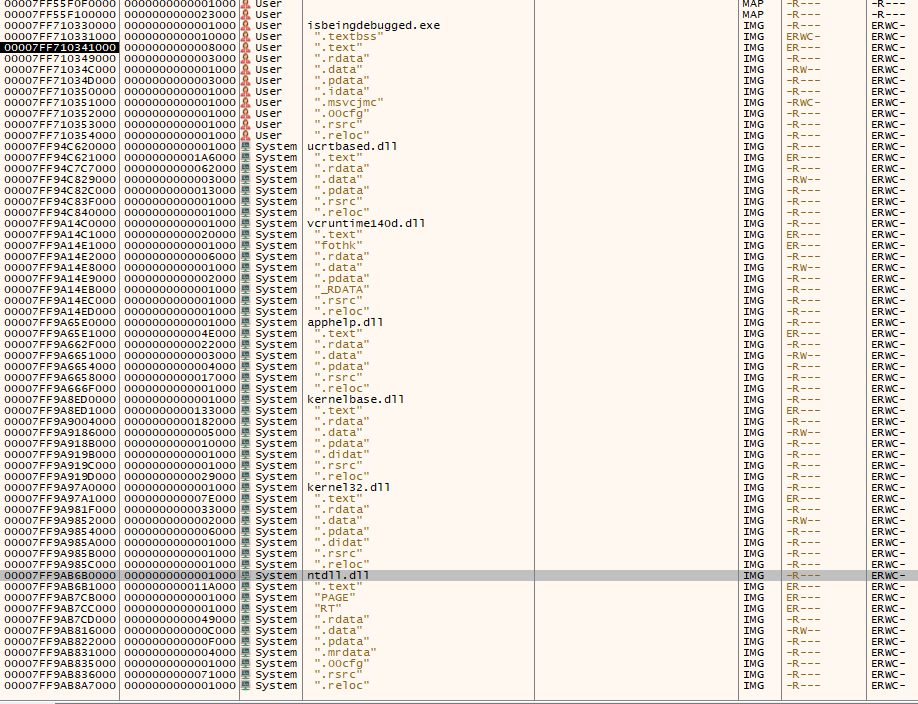
If we take the address of DllBase (0x00003310F77F0000) in Memory Map of x64dbg, we see that the current element of the LDR_MODULE struct (since we previously followed the flink pointer of InLoadOderModuleList) is actually our executable:

The 8 bytes that follow are the entry point of the exe.
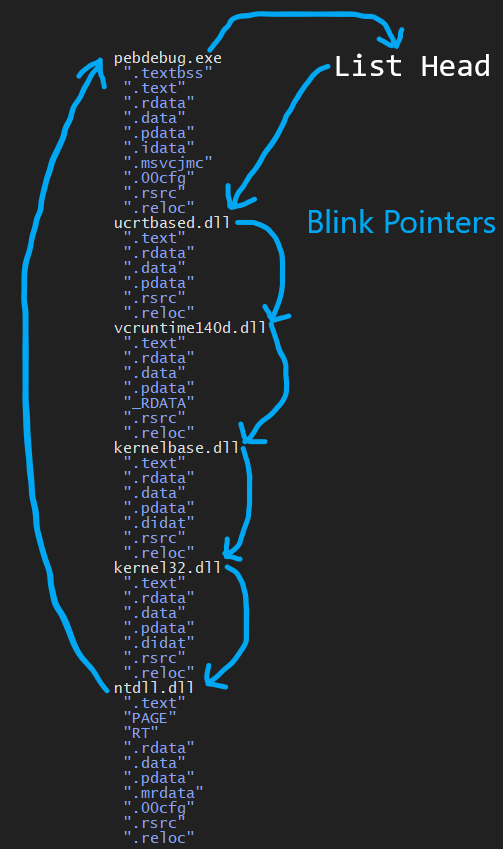
If we follow the same process and follow the Flink Pointer of the current module (our exe), it will lead to the next element (module) of the list, which if we follow as previously the DllBase, we will see its the ntdll.
In the same memory map we see these modules, we can actually see the order they have been loaded:
In an image @r4sti painted, we can see the logic behind these Flinks we followed:
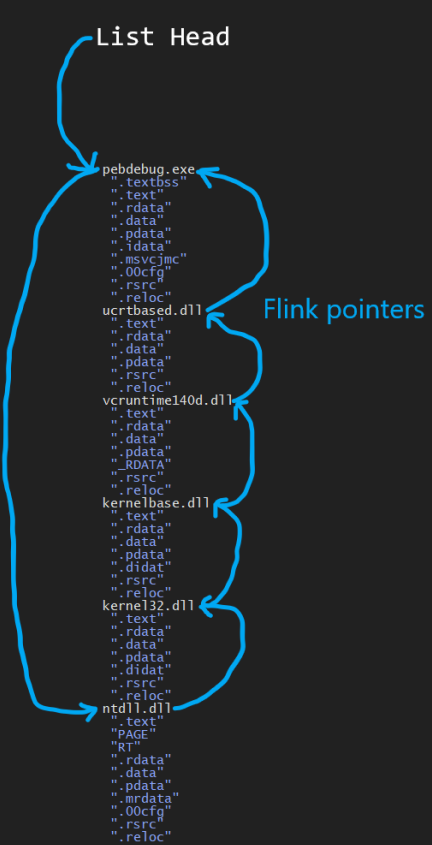
The same idea is applied for the Blink pointer. This would result in us landing in the previous ldr module, where - if you can guess based on the previous image - will be the ucrtbased.dll:
What’s next
After we got a grasp of the structures and how to enumerate modules, me and r4sti thought API Hashing would be a good next topic to study. So in the next post I’ll share what we learned about how to avoid using direct API DLL names and solely use them by their hash.
References
- [1] Ariel Silver, Automation Engineer: Defense Evasion Techniques – PEB Edition
- [2] GB_MASTER: WRITTEN BY GB_MASTER FEBRUARY 26, 2012 ON THE ROAD OF HIDING… PEB, PE FORMAT HANDLING AND DLL LOADING HOMEMADE APIS – PART 1
- [3] hackingump: PEB: Where Magic Is Stored
- [4] Mohamed Fakroud: Digging into Windows PEB