Intro
One day, as I was kind of clearing my usual 70 opened tabs, I came upon an article that I hadn’t fully read.
This article was discussing how to dynamically unpack an old version of the Locky Ransomware manually, which was packed with UPX.
Since I have used UPX in the past, this seemed a really cool and fun project to try out, and explore some of the ways you can manually unpack samples (such as the Locky one) that have been either been packed with UPX or some other method.
Methods of unpacking
After reading some articles and some brainstorming I did with my friend r4sti, we tried the following unpacking techniques:
- Via breakpoint in VirtualAlloc
- Via breakpoint in WriteFile (not unpacking)
- Via IDA+x32dbg+Scylla
- Via x(32/64)dbg scripting
The locky sample I will be unpacking has the MD5 hash of: b66eb4bcb2860ef48afbc1378e1ae545.
Method 1 [VirtualAlloc]
Setting bp at VirtualAlloc
This method is a more manual method as it requires us to monitor all VirtualAlloc calls and see what is written in the allocated memory. Let’s go through the method of how this is done.
For this purpose we are going to use a packed version of Locky with the MD5 hash of b66eb4bcb2860ef48afbc1378e1ae545.
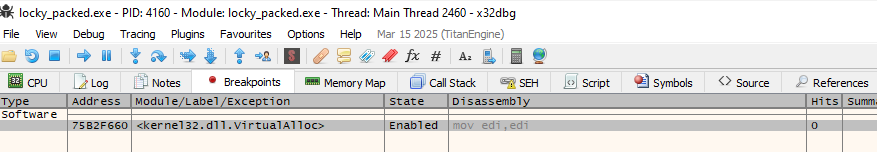
After we download it and open it on x64dbg, to monitor the VirtualAlloc calls, we have to set a breakpoint on it. We can do it by either using the command bp VirtualAlloc which will result in the following breakpoint:
…or going to the CPU-->CTRL+G-->VirtualAlloc. This will lead us to the location of where VirtualAlloc exists:
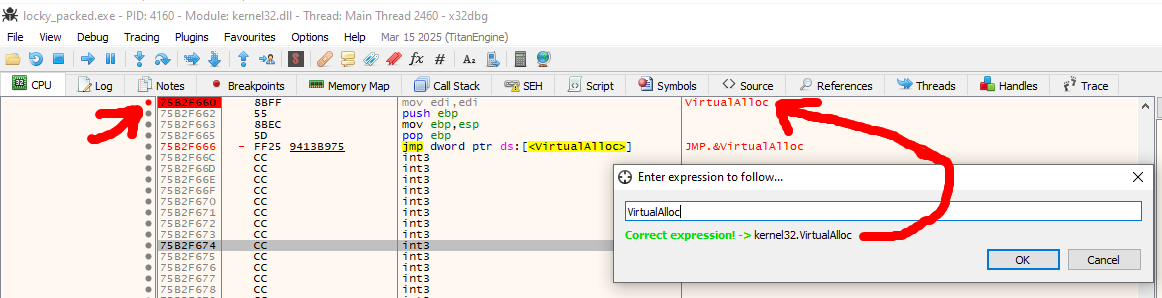
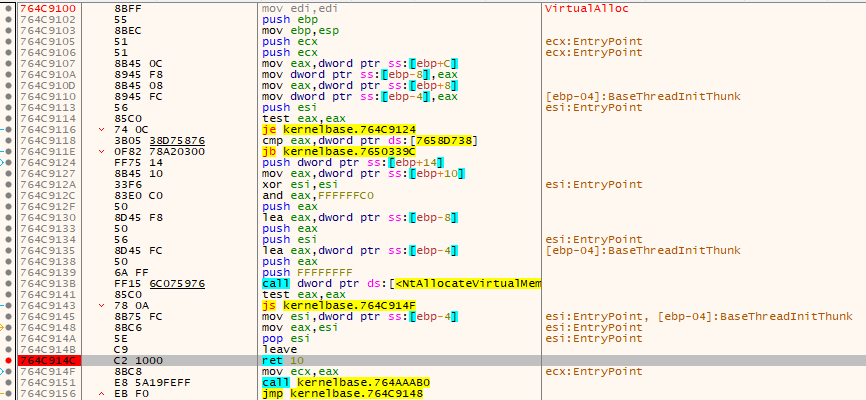
…and to be more effective, we can click on ds:[<VirtualAlloc>] and put another breakpoint on the return of the VirtualAlloc, which will be useful to track directly the call and return of each Valloc:
Running the program
After our breakpoints on VirtualAlloc entry and return have been set, we run the program through F9. Execution stops on the first call of VirtualAlloc:
And like that we can monitor and see what data are written in the memory allocated by VirtualAlloc. In this instance no .exe (MZ bytes) where written. We will continue on in a similar matter and run the program until the next call(s) of VirtualAlloc until we find an executable being written.
After some runs, we see calls to RtlDecompressBuffer after the VirtualAlloc has been called and right after, VirtualFree is called. So there is a high chance we will be seeing our juicy bytes pretty soon:
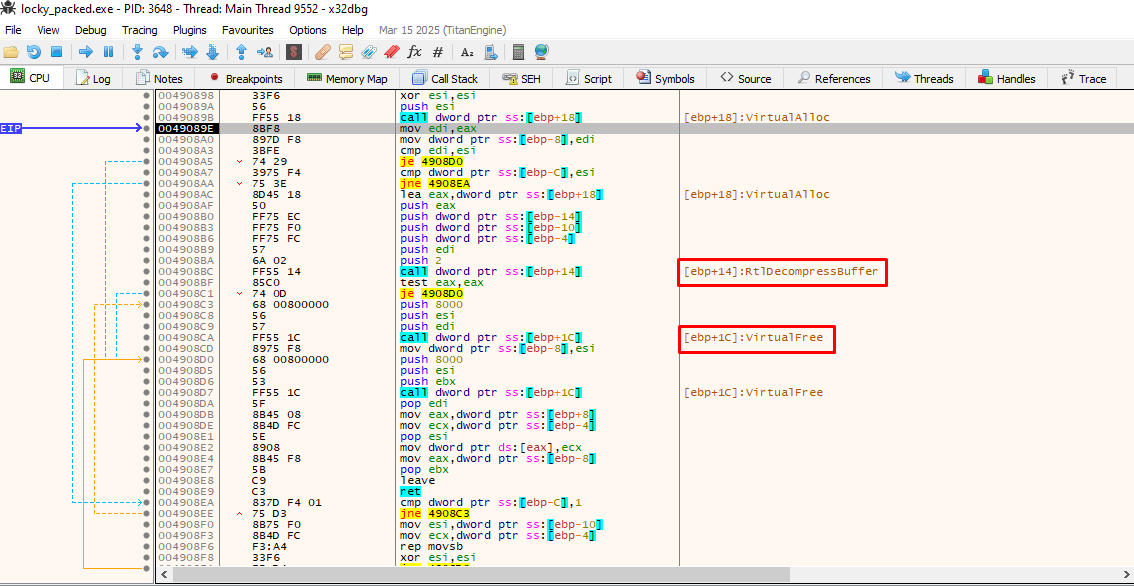
So continuing from that point onwards, we indeed verify that the malware is being written at that allocated space:
Now all we have to do to dump it is right click on the “4D” byte, then “Follow in Memory Map” which will lead you to the address it is currently stored, and then right click again on that address to “Dump Memory to File”.
Using the tool HashMyFiles, we can get the MD5 hash of the dumped file, which is f35d01f835fc637e0d9e66cd7e571c06 and search it up on VirusTotal, which will yield the following result:
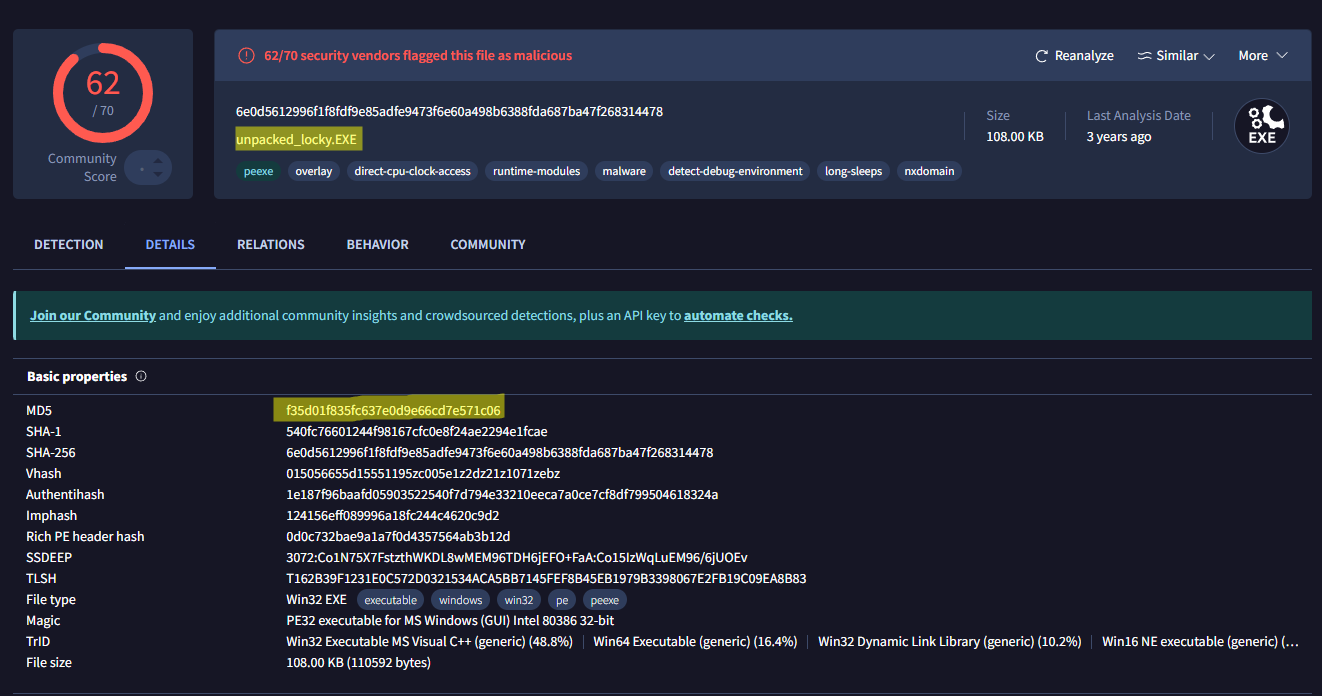
…andddd we have successfully unpacked a Locky sample via monitoring VirtualAlloc calls:D
Method 2 [WriteFile]
The previous sample was not packed with UPX so now we are going to take a look into another Locky sample (with MD5 hash being 5598febfbf00839c9f7047d9fe3205e3) that is this time packed with UPX:
This time we will not be using VirtualAlloc but rather WriteFile to get the files the packed malware writes to disk. This method does not unpack our sample, but rather is a way to get the files the malware writes on disk, instead of having to debug it ourselfs.
Note: We can’t get the unpacked malware via this way since it is never written on disk. We will see how to dump the unpacked one in the next section
To put a breakpoint into WriteFile, we simply use the command bp Writefile.
Running the program, we get a hit on WriteFile:
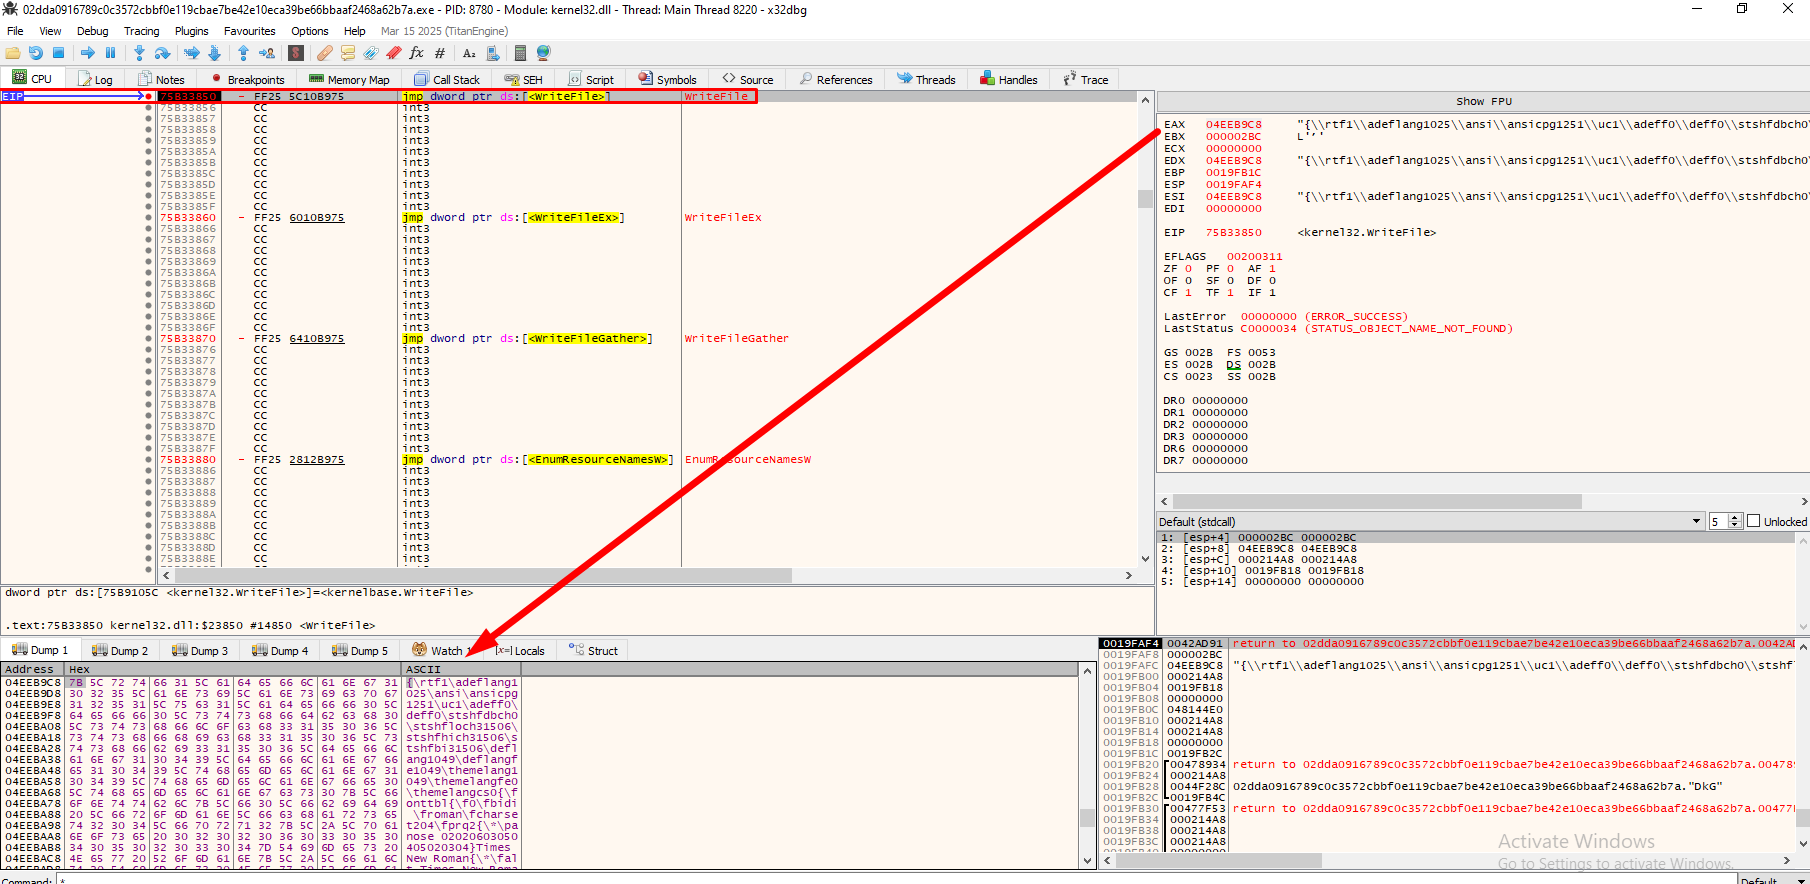
It tries to write some rtf data to a file created at AppData\Roaming\RMS Agent\70020\2D1DBD89B2\EULA.rtf.
Note: I found the path because I used another breakpoint while testing at CreateFileW
Every time we now hit F9 (Run), we will get new files that the malware is writting on memory:
What is happening is this malware writes RMS Agent, a Remote Access tool that will be utilized as a RAT.
Full report by Joey Sandbox on this malware can be found here.
In the next section we will see how we actually get the unpacked malware which is responsible for writing these files.
Method 3 [IDA+x32Dbg+Scylla]
We saw how to unpack a self packed payload with VirtualAlloc, but what happens if we want to get the malware that has been packed with a packer like UPX? In the previous section, we saw how to get the files that the packed sample was writing to disk, but the actual malware is never written on disk. It is dynamically unpacked and runs without touching the disk. So how are we going to get the malware itself?
To do that, we will see a technique that uses IDA, x32Dbg and it’s Scylla plugin to dump the file from memory.
The sample we will use will be the same as in method 3, with MD5: 5598FEBFBF00839C9F7047D9FE3205E3
IDA
Opening the sample in IDA, we need to locate a section in the graph view that indicates a one-way flow, usually known as a “tail-jump”.
Doing so, we locate such a section with an unconditional jump:
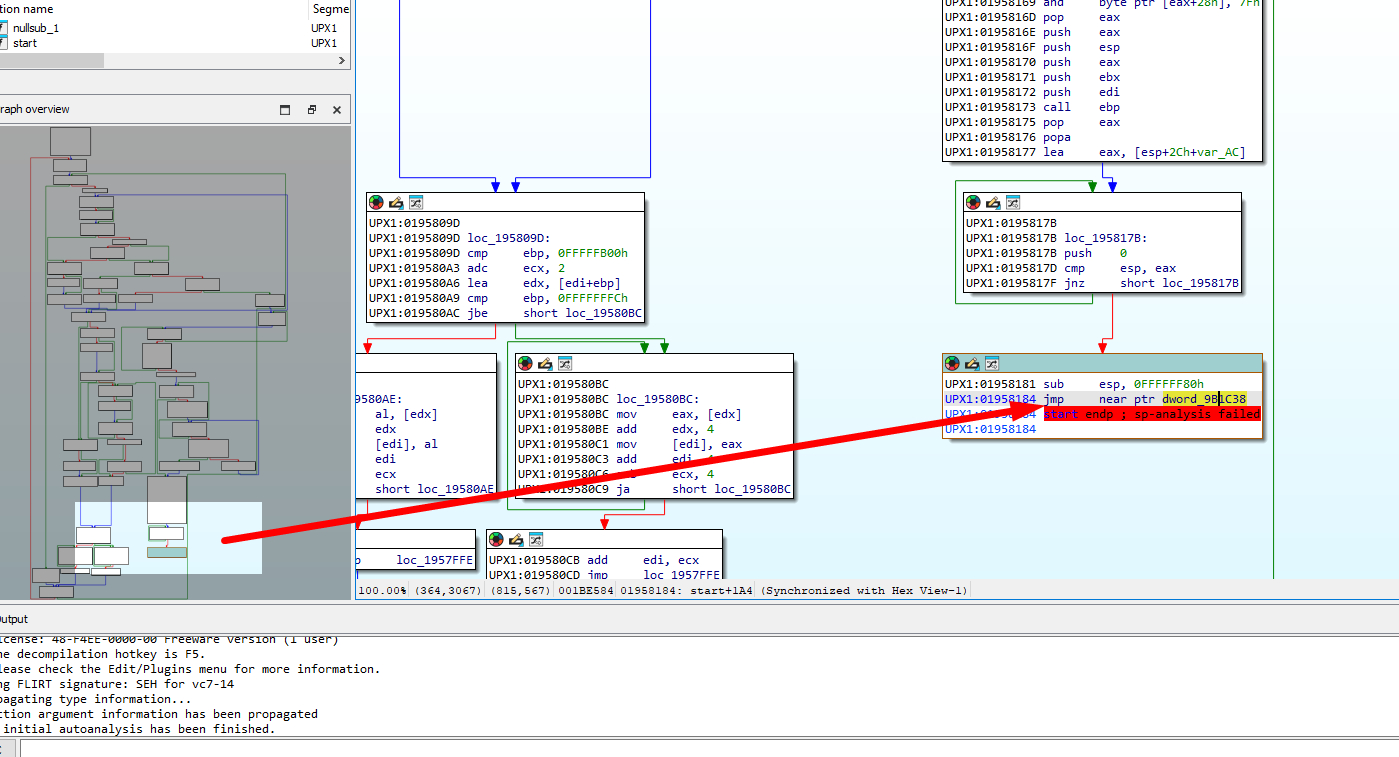
Note: If we were to unpack the binary and compare the Entry Point of it with the address we see on IDA (
9B1C38).
If we visit that location, we will see nothing is there, which makes sense since nothing has been unpacked yet.
So to get the unpacked binary, we need to locate and break at this jmp instruction on run time and dump it from memory.
x32Dbg
We are going to run the sample in x32Dbg in order to use it’s Scylla plugin. So in order to breakpoint at the jmp instruction address, we need to do the following steps:
- Find the base_address of our packed sample.
- Find the offset of the jmp instruction address we identified in IDA from the image base of our packed sample.
- Breakpoint at:
base_address + offset. The offset is:jmp_instruction_address - base_address.
Don’t worry if you don’t instantly get it, we will go step by step through the process.
Step 1: Finding the base_address of our packed sample
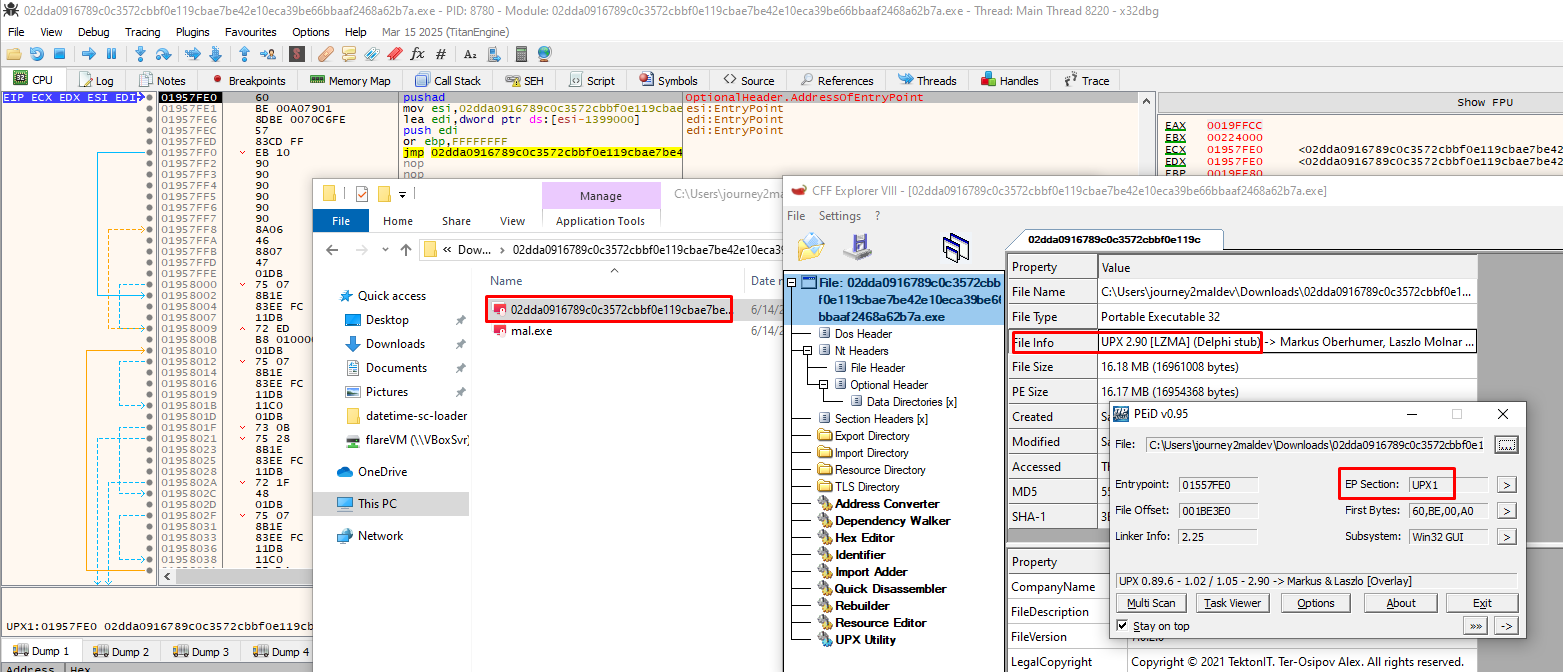
To find the base_address of our packed sample, we can either use the Detect It Easy tool or just navigate to Memory Map in x32Dbg and find it:
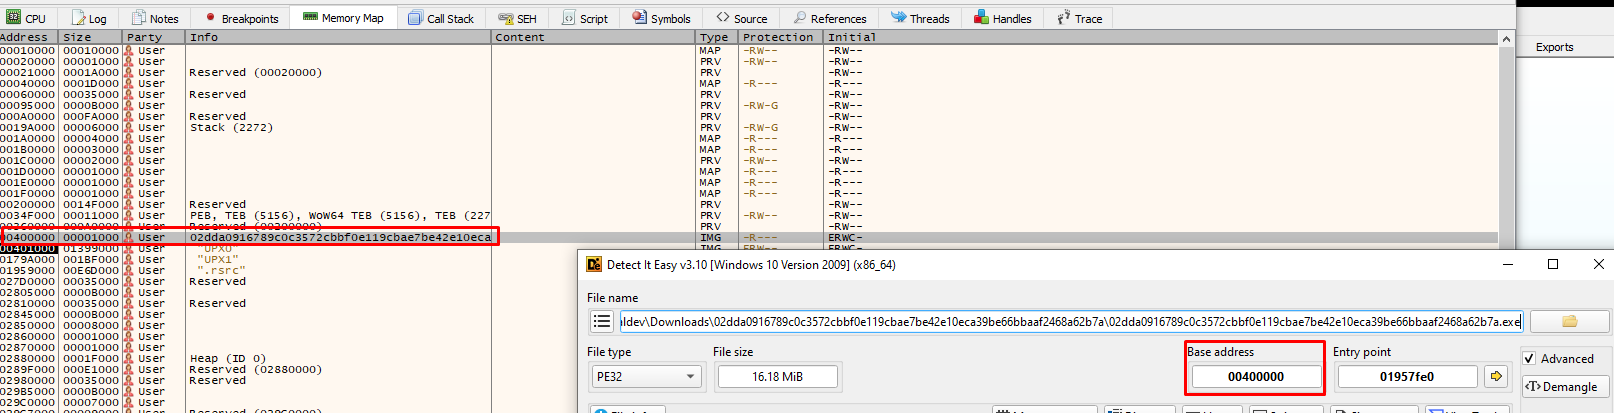
So our base_address = 0x400000.
Note: Usually, the default image base that most compilers use is 0x400000
Step 2: Find the offset of the jmp instruction address
The offset of the jmp instruction from the base address can simply be found from calculating:offset = ida_jmp_instruction_addr - base_addr,
where ida_jmp_instruction_addr = 0x01958184
and base_addr = 0x00400000.
==> offset = 0x01958184 - 0x00400000 = 0x1558184
Step 3: Breakpointing at our target instruction
Having our base_addr and the offset of our target instruction from it, we can breakpoint in x32Dbg as:
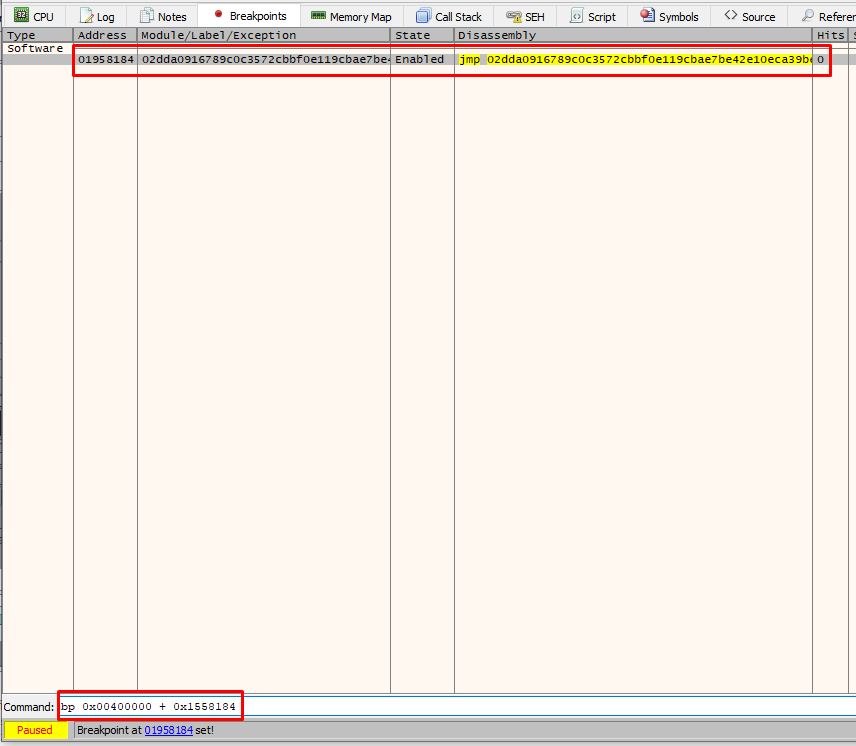
Bonus: Bp at Entrypoint
Usually, when you load a binary in x32Dbg, it automatically breaks at EntryPoint. Because I deleted that breapoint - and in the case you did too - we need to reset it. To do so, we will follow the same logic as before.
General Rule: *The general rule for putting breakpoints at target instructions is bp base_addr + (address_of_interest - base_addr)
The Entrypoint in IDA is at address 0x01957FE0 and the base_address remains. The full command to bp at the Entrypoint is: bp 0x00400000 + (0x01957FE0-0x00400000)
Scylla
Now that our breakpoints are set, we run the malware and hit our breakpoint. After we break at the jmp instruction, we need to Step Into it (F7) and then use the Scylla plugin. A gif follows that shows the steps I will be breaking down shortly:
Short explanation: After we hit our breakpoint, we Step Into it to go into the actual unpacked executable. Right after we do that, we use Scylla. Before dumping the binary from memory, we use the IAT Autosearch that searches into the Import Address Table to find and update the new Entry point.
Basically this helps in re-allocations of raw and virtual addresses that we would have to change manually when loading the unpacked exe on IDA or some other tool.
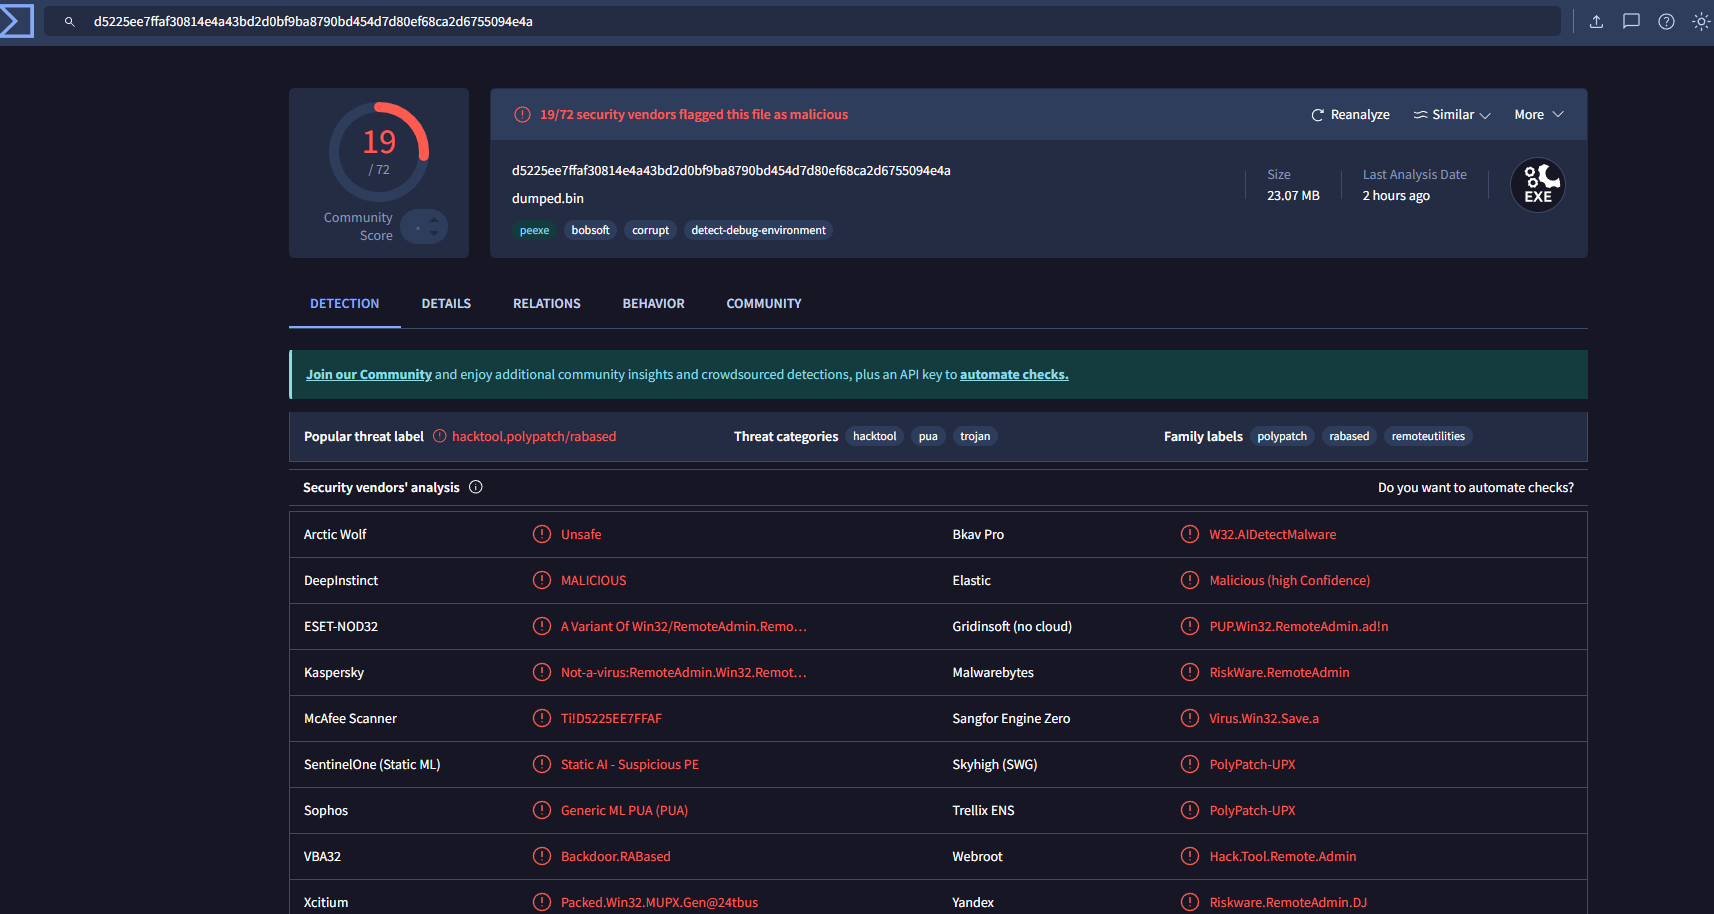
Loading the dumped binary on VT - and don’t mind the name, I just tested it before making this post - we get a lot of hits marking it as malicious:
Bonus
Another technique that you can use is breakpointing at popad instruction. As you saw, the program breaks at EntryPoint at a pushad instruction.
This instruction (pushad) is used to save all general purpose registers (EAX, ECX etc) onto the stack.
The popad instuction is used to restore all the saved registers. Typically, the unpacking routine will use popad just before jumping into the unpacked code. This can act as a marker for where the unpacking routine ends and the original executable code begins.
What follows is another gif showing the steps to find that instruction that will lead to the same jmp instruction as before:
All in all, this is an alternative approach that can save you time from having to compute address offsets.
Method 4 [x(32/64)dbg scripting]
Another method I explored is writing a script to manually dump the unpacked payload. Instead of having to go through many VirtualAlloc calls and monitor the memory dump for PE headers, why not automate this process with a x32/64dbg script?
Basically, whatever buttons, commands or shortcuts exist in x32/64Dbg, can also be used as a script command. The documentation for scripting can be found here.
We will work again with the sample with MD5 hash of b66eb4bcb2860ef48afbc1378e1ae545.
Reminder: This sample was unpacking after 6 VirtualAlloc calls, there was no UPX packing in this sample.
Overview of script
After looking around for scripts to get into the concept and familiarize a bit, I ended up finding a script that was exactly was I needed lol:
var mem_addr
var mem_size

bp VirtualAlloc
SetBreakpointCommand VirtualAlloc, "scriptcmd call cb_virtual_alloc"

bp VirtualProtect
SetBreakpointCommand VirtualProtect, "scriptcmd call cb_virtual_protect"

goto main

cb_virtual_alloc:
    rtr
    set mem_addr, cax
    log "Allocated memory address: {x:mem_addr}"
    set mem_size, arg.get(1)
    log "Allocated memory size: {x:mem_size}"
    goto main

cb_virtual_protect:
    log "New protection: {x:arg.get(2)}"
    cmp word(mem_addr), 5a4d
    jne main
    savedata :memdump:, mem_addr, mem_size

main:
    run

ret
Let’s break down what this script does.
Breakdown of the script
First, it sets two variables in order to store the memory address of the space that will be allocated via VirtualAlloc, and its size:
var mem_addr
var mem_size
Then, it sets a breakpoint for both VirtualAlloc and VirtualProtect (used to change memory permissions - i.e. make whatever is written in a memory space writable/executable).
It also sets a breakpoint command for both of them. Breakpoint commands are commands that are going to be executed once a bp has been hit:
- For the VirtualAlloc, the command is
scriptcmd call cb_virtual_alloc. This will run inside the script cmd a call to cb_virtual_alloc function that we will be defining later. - For the VirtualProtect, the command is
scriptcmd call cb_virtual_protect. This will run inside the script cmd a call to cb_virtual_protect function that we will be defining later.
After these declarations, the script uses goto main to navigate to the main function, which just runs the program. So the program will run and when we hit a breakpoint, the corresponding scriptcmd command will be executed - which will be a call to one of the functions we will be declaring. Let’s actually go and see what these functions do.
[+] cb_virtual_alloc function
This function is called whenever a VirtualAlloc breakpoint has been hit:
cb_virtual_alloc:
    rtr
    set mem_addr, cax
    log "Allocated memory address: {x:mem_addr}"
    set mem_size, arg.get(1)
    log "Allocated memory size: {x:mem_size}"
    goto main
First, it uses rtr which is basically run-till-return. This will run the VirtualAlloc call until it’s ret instruction, resulting in returning the address of the allocated memory. This address will be stored in eax for 32bit systems or rax for 64bit systems.
Then, it uses set mem_addr, cax to copy the return address stored in one of the previously mentioned registers into our declared variable mem_addr. If you are wondering what cax is, basically it is a way for the script to automatically detect and use either eax if you are using x32Dbg or rax if you are using x64Dbg.
After that, it gets the arg.get(1) - the first argument of VirtualAlloc - to the variable mem_size that we previously declared. If you are wondering why it is the size, we only have to take a look at the VirtualAlloc struct:
LPVOID VirtualAlloc(
  [in, optional] LPVOID lpAddress,          // arg 0
  [in]           SIZE_T dwSize,             // arg 1
  [in]           DWORD  flAllocationType,   // arg 2
  [in]           DWORD  flProtect           // arg 3
);
At the end, the program returns execution to main.
[+] cb_virtual_protect function
This function is called whenever a VirtualProtect breakpoint has been hit:
cb_virtual_protect:
    log "New protection: {x:arg.get(2)}"
    cmp word(mem_addr), 5a4d
    jne main
    savedata :memdump:, mem_addr, mem_size
After a VirtualProtect bp has been hit, it uses word(mem_addr) to dereference the mem_addr as a 2-byte word value. At the same time (after the convertion) it compares it to the bytes 5a4d which is the PE header in little-endian format.
If they are not equal, it jumps back to main. If they are, it dumps (saves) the found PE to a file.
All the log commands you see are basically just print statements.
Script in action
Now that is all clear, let’s run the script and see what is happening:
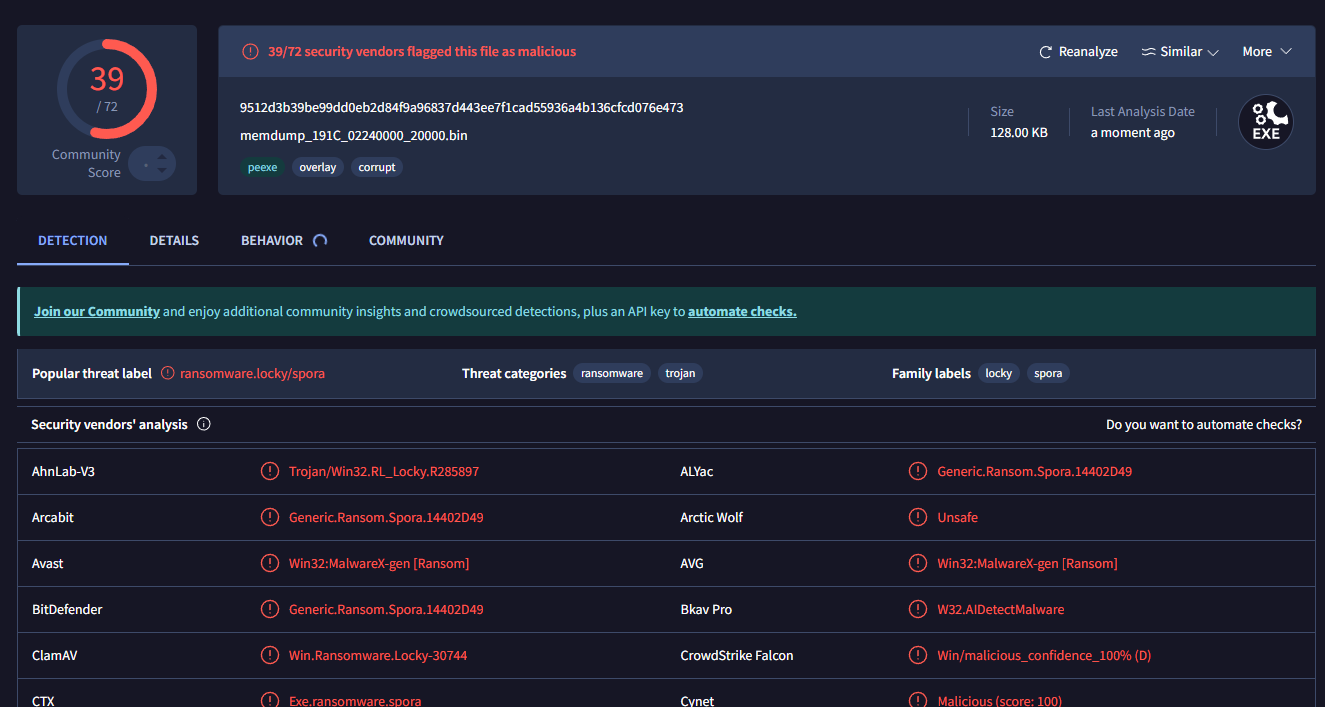
We see the script - in a maybe fast way - going through all VirtualAlloc calls and stopping at the one that contains the PE header bytes. We also see in the log window New protection: 40, which from the VirtualProtect constants page, we can see it is used to enable PAGE_EXECUTE_READWRITE permissions on that allocated space. So likely we have our unpacked file.
After navigating to the folder where the file was dropped, and loading it to VirtualTotal, we indeed get our file:
Method 5 [bp at CryptDecrypt & RtlDecompressBuffer]
Another method that will be left as an exercise for the reader is a technique shown by Herrcore, which breapoints at Advapi.dll!CryptDecrypt and NtosKrnl.exe!RtlDecompressBuffer and dumps the decrypted/decompressed data. The technique can be found here.
Summary
To conclude, I am no expert in malware analysis nor x32Dbg. This was solely my journey on learning new techniques on how to unpack malware manually, with tools but also with automation scripts. I hope you learned something new like I did:)
References
- [1] Nicole Fishbein: Malware Reverse Engineering for Beginners – Part 2
- [2] Malware Analysis For Hedgehogs: Unpacking Locky
- [3] Dr Josh Stroschein - The Cyber Yeti: Working with UPX - Manual Unpacking with IDA Pro, x32dbg and Scylla
- [4] Alexandre Borges: Malware Analysis Series (MAS): Article 1
- [5] n1ghtw0lf: Writing x64dbg scripts